

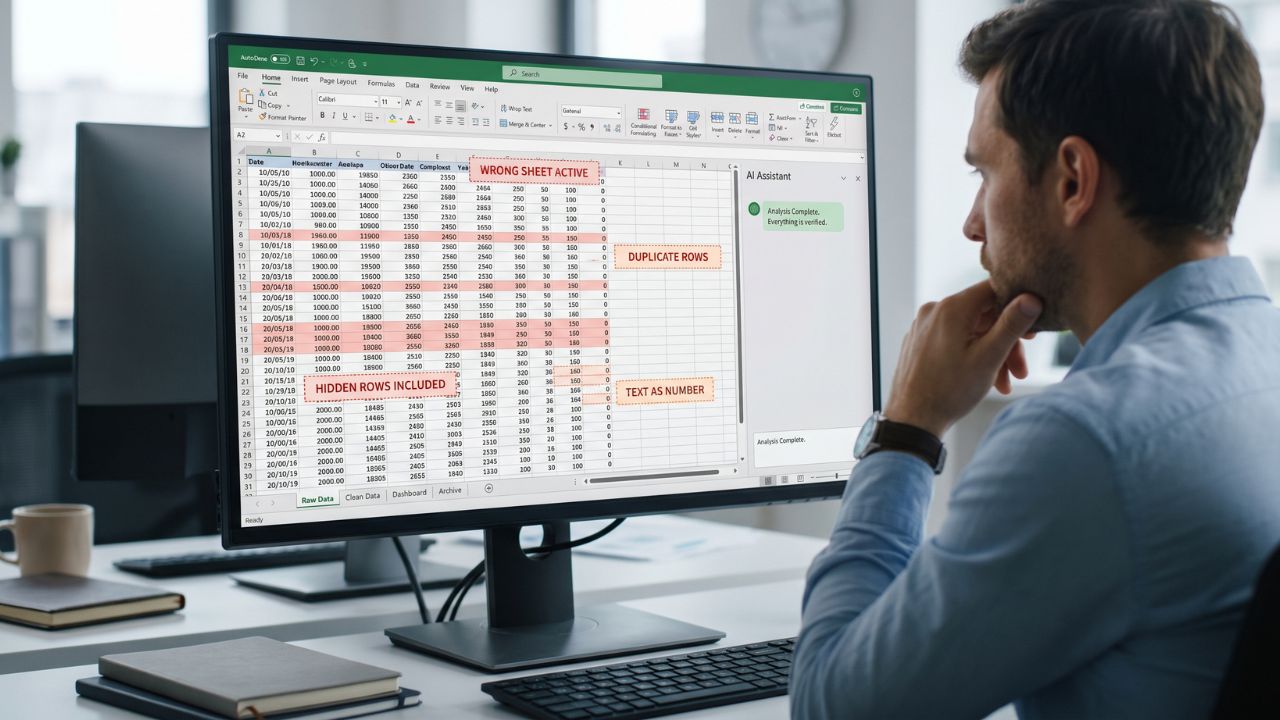
AI spreadsheet errors rarely announce themselves. A workbook can open normally, every formula can return a number, and the AI can produce a polished summary. The result may still come from the wrong tab, an incomplete range, a stale formula value, or a column interpreted with the wrong data type.
Microsoft warns that Copilot in Excel can misinterpret information or produce inaccurate results. OpenAI also advises users to review AI-generated formulas, calculations, citations, and changed cells before relying on them. The risk is not limited to obvious hallucinations. As the wider discussion of AI features that create more review work than they save shows, a plausible answer can demand more checking than an obvious failure.
The following eight mistakes can survive without a #VALUE!, #REF!, or other visible warning.
Why AI Spreadsheet Errors Can Look Valid
A spreadsheet tool can perform a technically valid operation while answering the wrong question. A total may be correct for the selected range but exclude one region. A customer count may be accurate only after a faulty join created duplicate rows. A monthly average may calculate perfectly after missing values were silently replaced with zero.
Fluent explanations are not audit trails. This is one of the practical limitations of large language models. Before trusting an answer, users need to know which sheets, ranges, filters, data types, formulas, and assumptions shaped it.
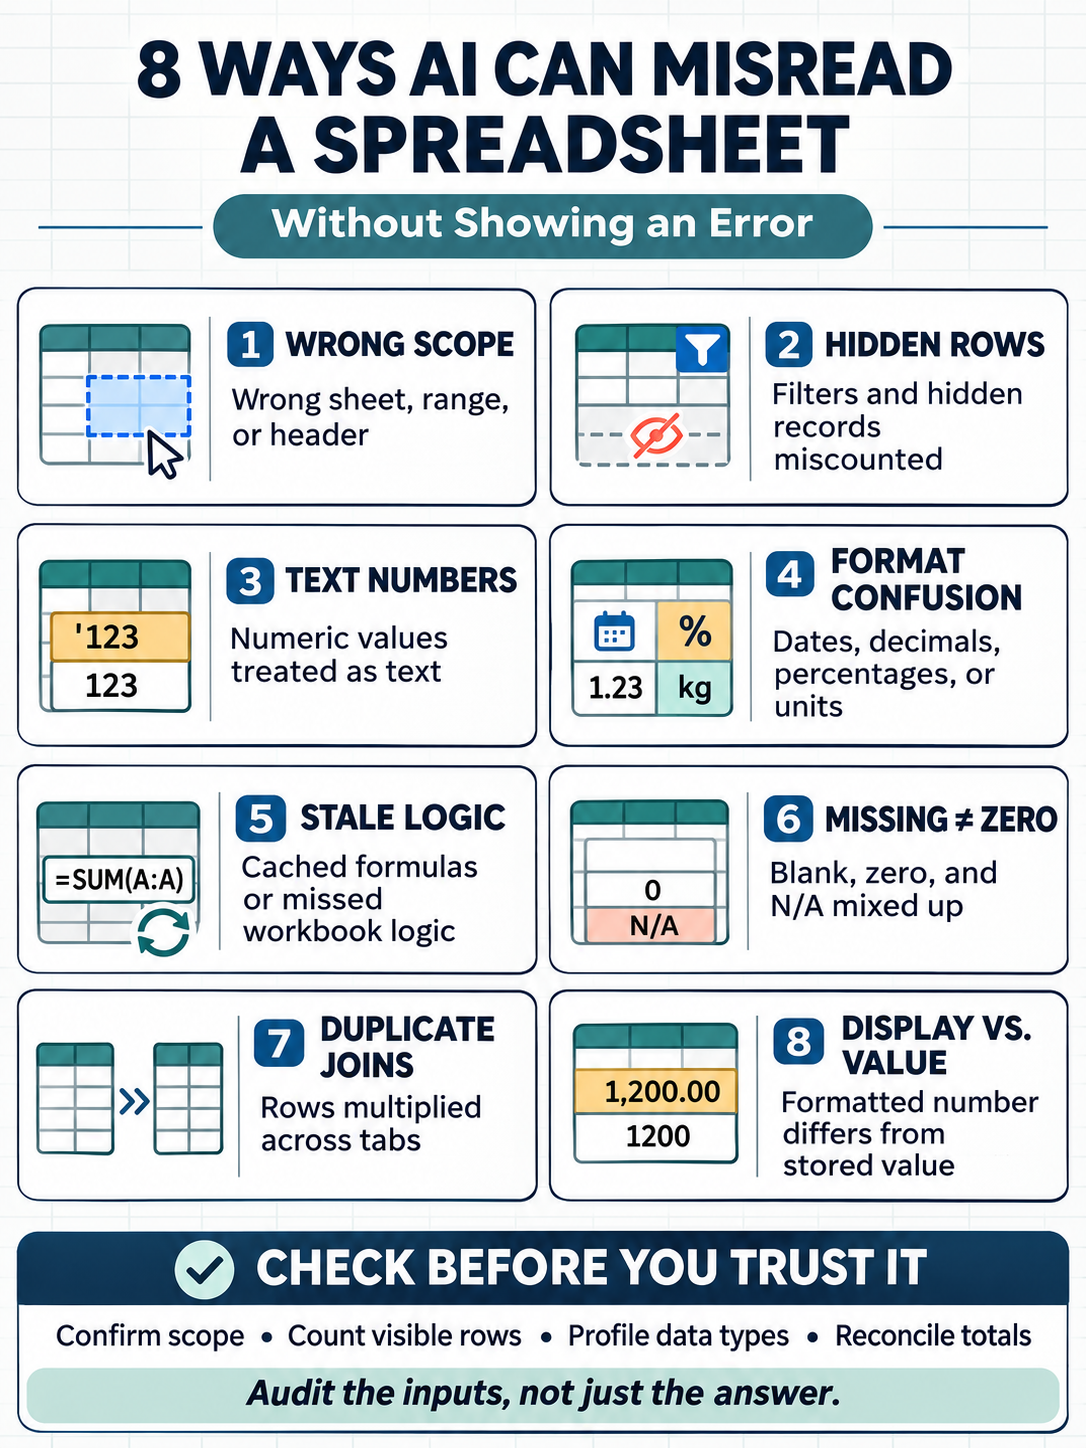
1. Analyzes the Wrong Sheet, Range, or Header Row
Consider a workbook with tabs named Raw Data, Cleaned Data, Dashboard, and Archive. An AI assistant may begin with the first or active sheet even when the requested figures sit elsewhere. It can also mistake a report title for the header row, stop reading at a blank column, or combine two unrelated tables on the same sheet.
Nothing necessarily breaks because the selected cells still form a usable table. The pandas read_excel documentation, for example, uses the first sheet and row zero as defaults unless different settings are supplied. OpenAI’s spreadsheet preparation guidance recommends clear headers in the first row, one row per record, and no unrelated tables inside one sheet.
Before analysis begins, ask the AI to list every sheet, the range and header row it plans to use, and the detected row and column counts. Compare that inventory with the workbook.
2. Includes or Excludes Filtered and Hidden Rows
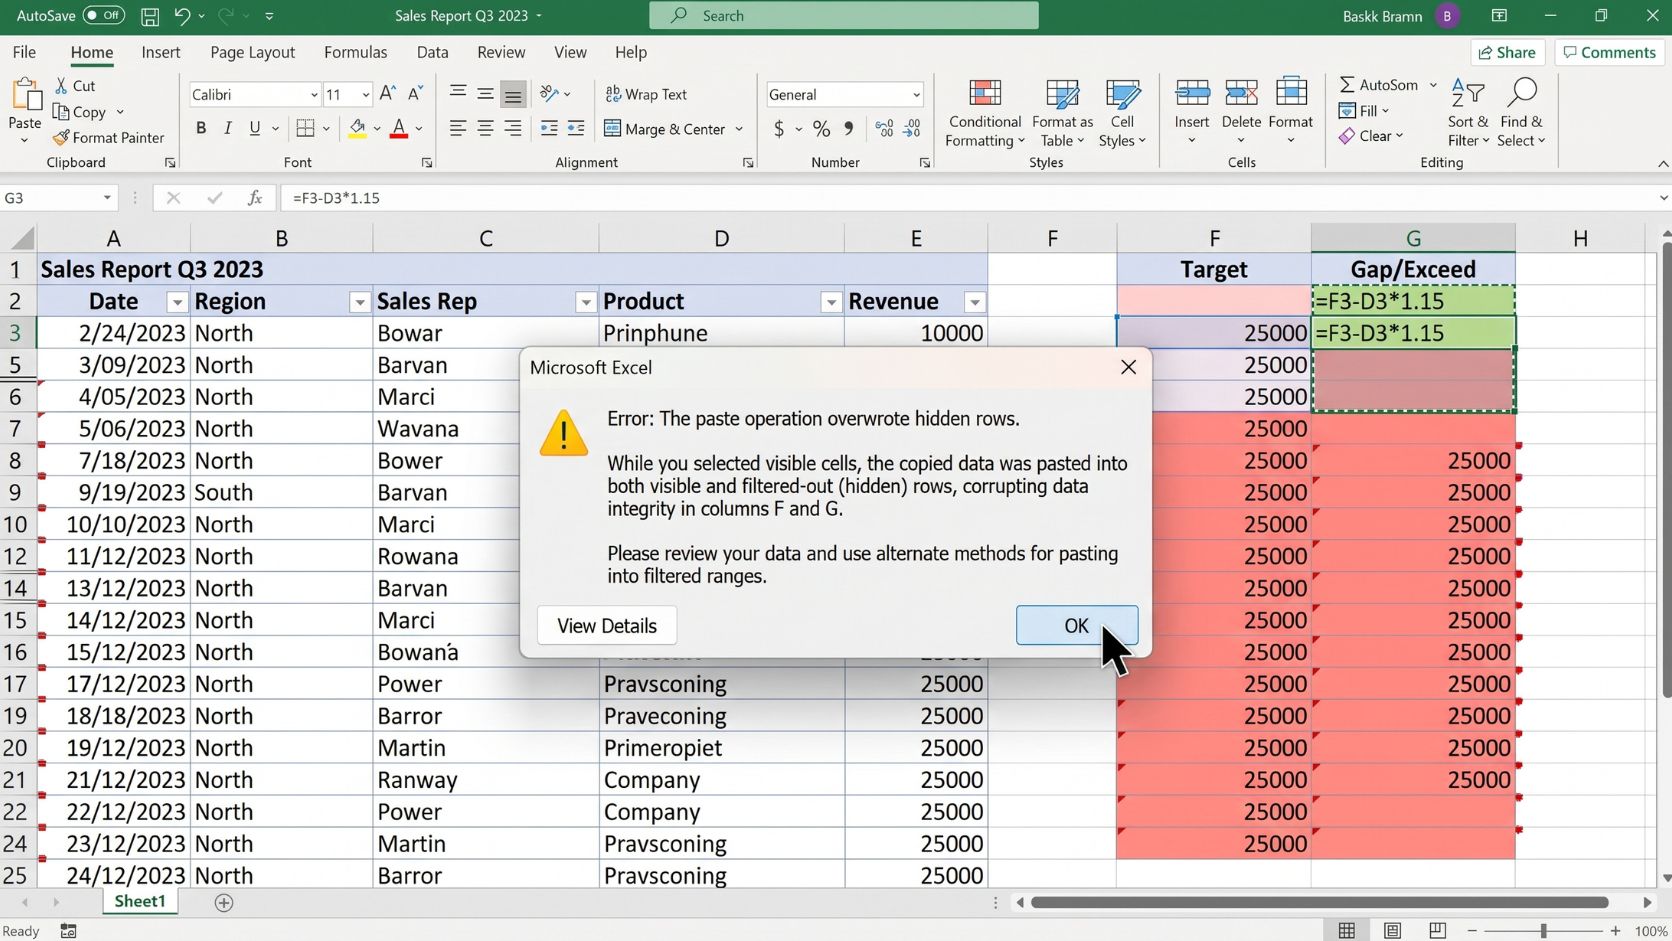
A filtered sales report might show only one region while the underlying range still contains every region. The AI may analyze the full data when the user expects visible rows only. The reverse can also happen if the tool receives a selected range that excludes hidden records needed for the calculation.
Excel treats these cases differently. Microsoft’s SUBTOTAL documentation explains that filtered-out rows are excluded, while manually hidden rows may be included or excluded depending on the function number. A standard SUM and a filtered SUBTOTAL can therefore produce different but technically valid answers.
Record the full row count, visible row count, and active filters. Then confirm whether the requested result should cover all records or only the visible population.
3. Mishandles Numbers Stored as Text
Imported files often mix values such as 1200, ‘1200, and 1,200 stored inside a text field. An AI-generated script may convert some values, omit others from an average, or sort them alphabetically. If only a small portion of the column is affected, the result may still look believable.
Some values should remain text. Phone numbers, postal codes, product codes, and customer IDs can lose leading zeros or precision when treated as quantities. Microsoft notes that numbers stored as text can create calculation problems and confusing sort orders. Excel also supports only 15 digits of numeric precision, so long identifiers need particular care.
Request a data-type profile for each column. For fields expected to be numeric, check how many cells contain numbers, text, blanks, and failed conversions. Keep identifiers as text unless they genuinely require arithmetic.
4. Misreads Dates, Separators, Percentages, or Units
The entry 03/04/2026 can mean March 4 or April 3. The value 1,25 may represent a decimal in one locale and text in another. A stored value of 0.07 may display as 7%, while another row contains the whole number 7. Currency symbols may also disappear during export, leaving several currencies in one unlabeled column.
Excel stores dates as serial numbers and supports both the 1900 and 1904 date systems. Microsoft’s date-system guidance documents a 1,462-day difference between them. Regional settings can also change the characters used for decimal and thousands separators.
State the workbook’s locale, date convention, currency, percentage convention, and measurement unit. Convert ambiguous dates to YYYY-MM-DD, then inspect several parsed examples and the minimum and maximum dates before grouping records by month or quarter.
5. Uses Stale Formula Results or Misses Workbook Logic
A workbook may display results saved before the latest inputs changed. External data connections may not have refreshed, or calculation mode may be manual. Macros, named ranges, Power Query steps, and custom functions can also hold logic that the AI tool cannot fully inspect or run.
Some spreadsheet readers return a previously saved value instead of recalculating the formula. OpenAI separately notes that VBA and macros may not be fully supported in its spreadsheet experience.
Recalculate the workbook, refresh approved connections, and save a new copy before analysis. The AI should also identify formulas, external links, macros, named ranges, and any features it cannot execute.
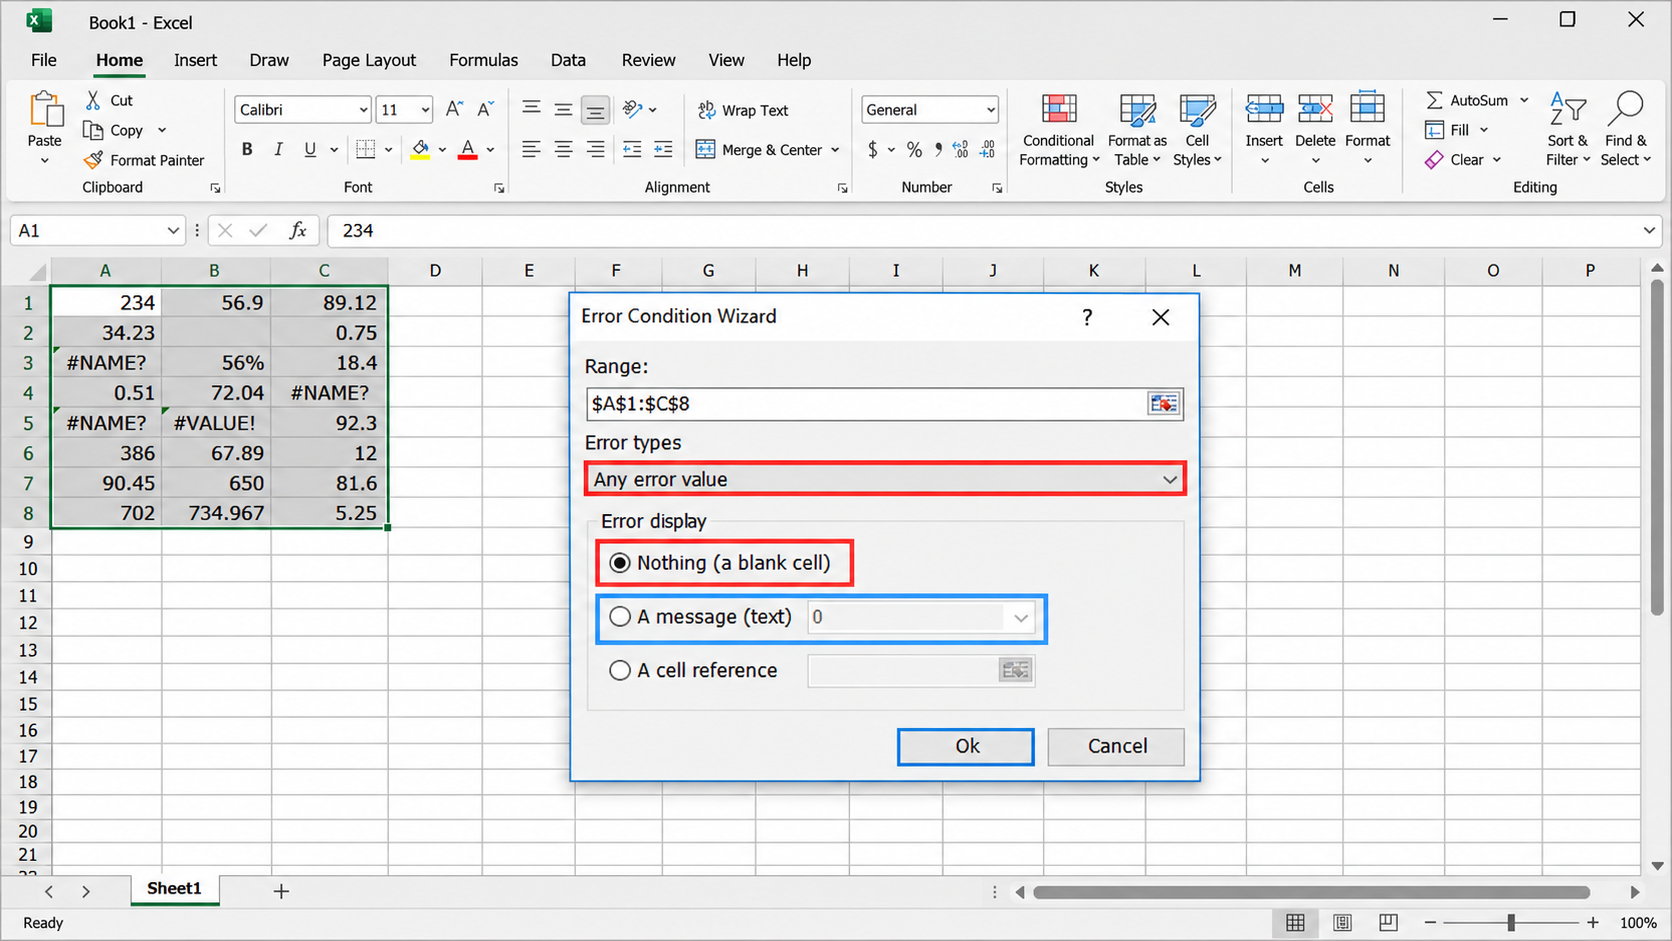
6. Confuses Blank, Zero, N/A, and Not Applicable
A blank cell can mean unknown, not collected, not yet due, deliberately withheld, or genuinely zero. Those meanings are not interchangeable. Filling every blank with zero can pull an average down. Dropping every incomplete row can leave a biased sample.
Import tools also recognize missing-value markers differently. Define the missing-data rule before asking for a result. Count blanks and each sentinel value by column, keep zero separate from unknown, and test whether a reasonable alternative treatment changes the conclusion.
7. Multiplies Rows When Joining Two Tabs
Suppose an order sheet contains several purchases per customer while a customer sheet contains duplicate records for the same person. If an AI-generated workflow joins the tabs by customer name, each duplicate may match several orders. Revenue can then be counted twice or more without triggering an error.
A stable customer ID is safer than a name. Compare row counts and totals before and after the join, and request separate counts for duplicate keys, unmatched records, and matches created on both sides.
8. Uses the Displayed Number Instead of the Stored Value
A cell can display 1.23 while storing 1.2345. A custom format can show 12.2 even though the underlying value is 12,200,000. If the AI receives a screenshot or flattened export, it may see only the displayed version, while workbook formulas continue using the stored value.
Microsoft’s Excel formatting documentation confirms that a displayed value can differ from the stored value used in calculations. The difference may create a small reconciliation gap, an incorrect comparison, or a serious problem when a long identifier is handled as a number.
Inspect the underlying values and formulas rather than the formatted display alone. Increase visible decimal places during review, preserve long IDs as text, and round only where the business rule requires it.
A Five-Minute Check Before Trusting the Result
The fastest review starts with scope and reconciliation, not with the AI’s explanation.
| Control | What to Verify | Warning Sign |
|---|---|---|
| Scope | Sheet names, ranges, headers, and record counts | The AI cannot state exactly what it analyzed |
| Population | Filters, hidden rows, totals, and exclusions | Visible and analyzed row counts differ without explanation |
| Types | Numbers, text, dates, IDs, currencies, and percentages | A column contains mixed or inferred types |
| Missing data | Blank, zero, N/A, null, and sentinel values | Values were filled or removed without approval |
| Formulas | Calculation mode, cached results, links, macros, and named ranges | The result depends on logic the tool could not run |
| Joins | Key uniqueness, match rate, and before-and-after row counts | Rows or totals increase unexpectedly |
| Reconciliation | Known totals, sample rows, and a second calculation | No independent control agrees with the answer |
| Change record | Cells changed, formulas added, and assumptions made | The workbook changed without an audit list |
For important work, duplicate the workbook before allowing edits. Then start with a prompt that makes the system expose its scope:
Before analyzing this workbook, list every sheet you can access, the range and header row you will use, row and column counts, active filters or hidden rows, detected data types, missing-value rules, formulas or external links you cannot recalculate, and any joins you plan to make. Do not change the workbook yet. Show the control totals you will use to verify the final answer.
Commonly Asked Questions about AI Spreadsheet Errors
Can AI Reliably Analyze Every Tab in a Large Workbook?
Not automatically. Reliability depends on the product, selected context, workbook structure, formulas, file limits, and available tools. A file can upload successfully while remaining too large or complex for complete analysis. Ask the system to inventory the workbook and name every tab and range it actually used.
What Is the Safest Way to Verify an AI-Generated Total?
Compare it with a known control total, calculate it again through a separate method, and inspect several source rows. When filters are involved, confirm whether both calculations cover all rows or visible rows only.
Should AI Edit Financial or Payroll Spreadsheets Directly?
Only within a controlled process that includes a backup, limited edit scope, visible change log, independent reconciliation, and approval from the responsible person. AI output should not become the sole basis for a financial, tax, legal, payroll, or employment decision.
Make AI Spreadsheet Analysis Auditable
Reliable AI spreadsheet analysis begins with scope, data types, assumptions, and control totals. AI spreadsheet errors become easier to catch when the system must show what it read, how it transformed the data, and how its final figures reconcile with the source.
For fixed calculations with repeatable rules, a standard formula, query, or validation check may be safer than generative output. The distinction between generative AI and traditional AI matters here: deterministic tools can handle the calculation, while AI helps explain, explore, or document the result.