
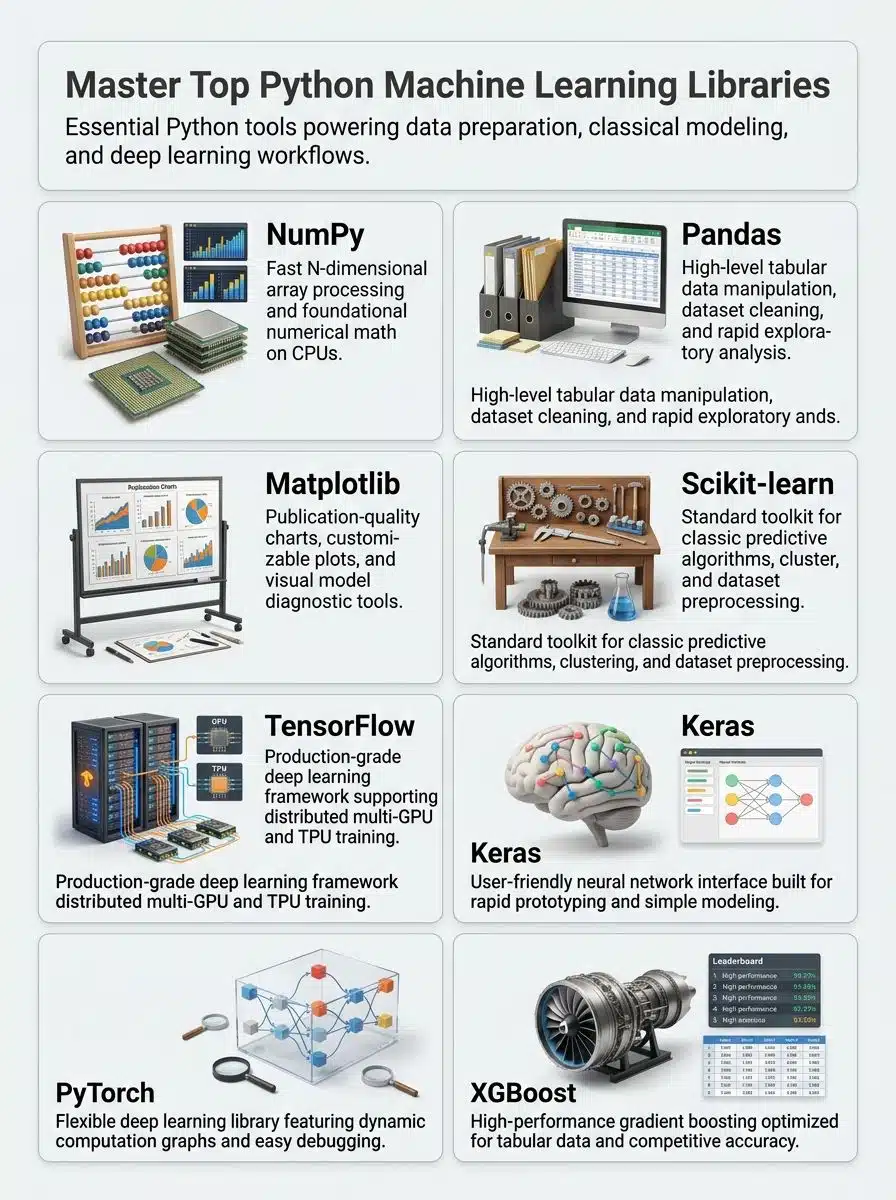
Ever open a new machine learning project and wonder which Python library should handle the job? The best Python libraries for machine learning each solve a different part of the workflow: NumPy handles arrays, Pandas cleans tables, Matplotlib and Seaborn expose patterns, scikit-learn builds classic models, and TensorFlow, Keras, PyTorch, and XGBoost take you into deep learning or high-performing tabular models.
I’ll walk you through all nine so you can spend less time swapping tools and more time testing useful ideas.
NumPy: A Foundation for Machine Learning Arrays
NumPy gives you fast, n-dimensional arrays for data manipulation, mathematics, and numerical computations. Most Python machine learning workflows touch NumPy, even when you write most of your code in Pandas, scikit-learn, TensorFlow, or PyTorch.
Its vectorized operations let you process a full column or matrix at once instead of looping through one value at a time. That matters when you need repeatable preprocessing before classification algorithms, regression analysis, or clustering algorithms.
As of August 2026, NumPy 2.5.2 is the current release. Its array, indexing, broadcasting, random-number, and linear-algebra tools make it a practical first stop for checking the shape and scale of training data.
- Check shape first: Use shape to confirm that rows represent samples and columns represent features.
- Check data type: Convert mixed numeric data to a consistent floating-point type before passing it to a neural network.
- Check spread: Calculate the mean and standard deviation to find columns that may need scaling.
For a quick sanity check, create an array of 500 float values and calculate the mean and standard deviation before training. If a feature has a mean around 2.27 and a standard deviation around 1.12, you have a useful baseline for spotting unexpected changes after feature engineering.
NumPy runs mainly on the CPU, so it is not your main choice for heavy GPU-powered inference or deep-learning training. When GPU work becomes the bottleneck, PyTorch, TensorFlow, JAX, or CuPy are better fits.
Pandas: Faster Data Manipulation and Data Analysis
Pandas turns messy files into usable machine learning data. Its DataFrame structure feels familiar if you work with spreadsheets, but it gives you code-driven filtering, joins, grouping, reshaping, and data preprocessing.
Use it when your source data has missing values, inconsistent labels, dates stored as text, or categorical fields that need cleanup before supervised learning or unsupervised learning.
The pandas project lists version 3.0.5 as its latest release, and the 3.0 line made copy-on-write behavior the standard. In plain terms, a filtered DataFrame behaves predictably as a copy, which helps you avoid accidental edits while preparing features.
| Data problem | Pandas move | Why it helps your model |
|---|---|---|
| Blank genre values | Fill them with the unknown. | Keeps missing categories visible instead of silently dropping rows. |
| Several genres in one field | Split the string and keep a primary genre | Creates a simple feature that classic models can use. |
| Repeated records | Find duplicates before the train-test split | Reduces the chance that near-identical rows inflate model evaluation scores. |
A strong habit is to inspect missing-value counts and column types before you encode anything. Pandas offers direct tools for both jobs, and that early check can save you from training on strings, dates, or nulls that slipped into a numeric feature matrix.
For larger data analysis jobs, load only the columns you need, choose efficient data types, and consider chunking a file instead of loading everything into memory at once. Then pass the cleaned result to scikit-learn, TensorFlow, Keras, or PyTorch.
Matplotlib: Data Visualization for Model Debugging
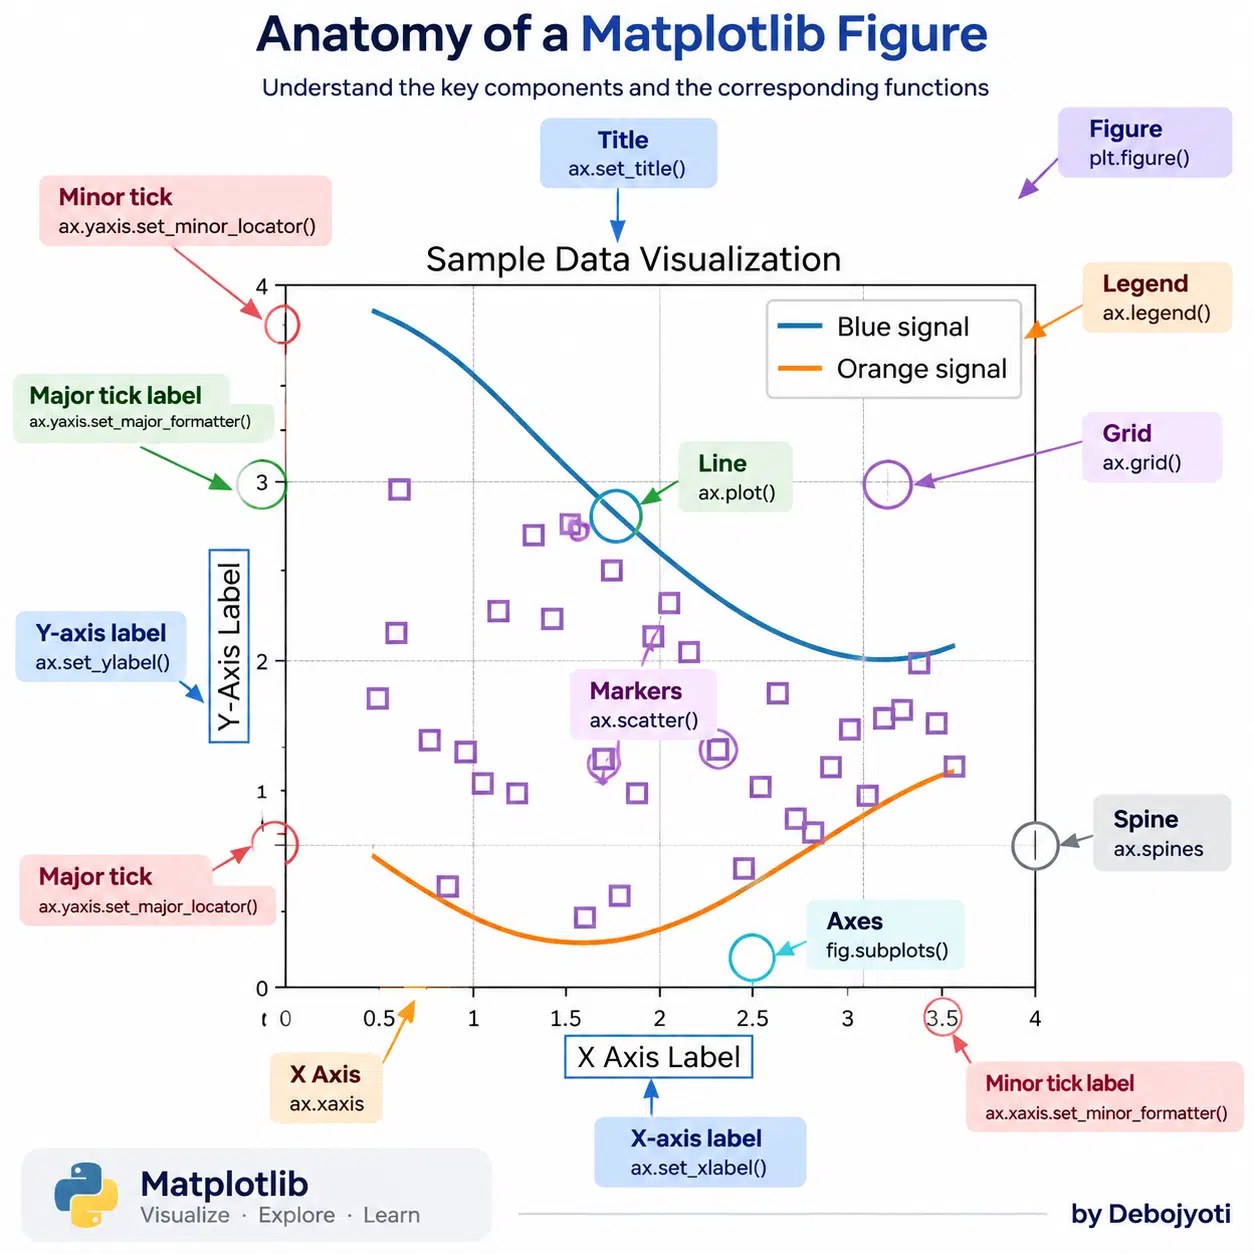
Matplotlib creates static, animated, and interactive data visualization in Python. It is the tool to use when you want full control over axes, labels, colors, annotations, figure size, and exported image files.
That control makes Matplotlib useful beyond presentation charts. You can use it to inspect training curves, class balance, feature distributions, residuals, confusion matrices, and prediction errors.
Matplotlib 3.11.1 is the current documented release, following the 3.11.0 release in June 2026. If you work in a notebook, start with a simple plot, label every axis, and add a title that states the question the chart answers.
- Histogram: Find skewed values, unusual ranges, and data-entry errors.
- Line chart: Compare training and validation loss across epochs.
- Scatter plot: Check whether two numeric features appear related.
- Confusion matrix: See which classes a classifier mixes up most often.
For example, split multi-genre values in Pandas, count the primary genre, and create a bar chart before training. If one genre dominates the data, accuracy alone may hide weak performance on smaller classes.
Use Matplotlib when you need a chart that belongs in a report, a technical tutorial, or an MLOps dashboard. Seaborn can get you to an exploratory chart faster, but Matplotlib gives you the lower-level controls.
Seaborn: Statistical Data Visualization With Less Code
Seaborn sits on Matplotlib and works naturally with Pandas DataFrames and NumPy arrays. It gives you clean defaults for statistical graphics, so you can ask better questions during exploratory data analysis without spending much time styling plots.
Its strongest use is finding relationships before a model turns them into numbers. A heatmap can expose correlated features, a box plot can reveal outliers by category, and a pair plot can show where groups overlap.
Seaborn’s documentation highlights its support for relational, distribution, categorical, regression, and multi-plot graphics. Its plotting functions also accept long-form data well, which is often the easiest format to produce from a Pandas group-by operation.
For model evaluation, Seaborn can show score distributions across cross-validation folds instead of leaving you with one average number. A spread-out set of scores suggests that your model may depend too much on the particular training split.
One practical caution: error bars can mean different things, such as data spread or uncertainty in an estimate. Set the error-bar option deliberately so your chart does not imply more confidence than the data supports.
Scikit-learn: A Practical Toolkit for Machine Learning
Scikit-learn is one of the best Python libraries for machine learning when you need reliable tools for tabular data, model evaluation, feature engineering, and classic supervised learning or unsupervised learning.
It is built on NumPy, SciPy, and Matplotlib, and it gives you a consistent interface across classifiers, regressors, clustering algorithms, preprocessing tools, and dimensionality reduction methods.
As of September 2026, scikit-learn 1.9.0 is the stable release, while 1.10 remains in development. The project typically ships major or minor releases about every six months, so pin your version in production work instead of assuming a teammate has the same behavior.
| Task | Useful scikit-learn tool | Good first move |
|---|---|---|
| Binary classification | Logistic Regression or Random Forest | Start with a baseline and inspect precision, recall, and the confusion matrix. |
| Numeric prediction | Ridge Regression or Gradient Boosting | Compare mean absolute error with a simple baseline prediction. |
| Customer or document grouping | K-means | Scale numeric features before clustering so one large-value column does not dominate. |
| Feature reduction | PCA | Use it to explore structure, then confirm that reduced features still help validation results. |
The Pipeline class is a habit worth building early. Put imputation, scaling, encoding, and the estimator in one pipeline so cross-validation applies the same data preprocessing to every fold.
Scikit-learn can work with some array types beyond standard NumPy, but it is still not the first choice for training large language models or big neural networks. Use it for fast baselines, then move to TensorFlow or PyTorch only when the problem really calls for deep learning.
TensorFlow: Scalable Deep Learning for Production Workloads
TensorFlow is a deep learning framework created by the Google Brain team and released as open source in 2015. It supports CPU, GPU, and TPU execution for neural networks used in computer vision, natural language processing, ranking, and other artificial intelligence tasks.
Its biggest advantage is scale. You can start with one device, then use tf.distribute.Strategy to run training across multiple GPUs, multiple machines, or TPUs with relatively small changes to your training code.
TensorFlow’s official distributed-training guide recommends using graph execution through tf.function for best results, while eager execution is better suited to debugging. That distinction matters when a notebook prototype needs to become a repeatable training job.
- Use Keras Model.fit: Best for standard image, text, and tabular neural network workflows.
- Use tf.data: Build input pipelines that can batch, cache, shuffle, and prefetch training data.
- Use MirroredStrategy: Share one training run across multiple GPUs on one machine.
- Use TPUStrategy: Run synchronous training on TPU hardware when the workload and budget support it.
For retrieval augmented generation or transformer fine-tuning, begin by measuring memory use and validation quality on one device. Adding more GPUs can speed training, but communication between devices means two GPUs rarely produce an exact two-times speedup.
TensorFlow is a good fit when your team wants a mature deep-learning stack with clear paths from experimentation to managed infrastructure, Kubernetes jobs, or production inference.
Keras: Simple Neural Network Development Across Backends
Keras was created by François Chollet to make neural network development easier to read and faster to iterate. It is a high-level API that lets you define layers, losses, metrics, callbacks, and training loops without writing every low-level operation yourself.
Keras 3 can run with TensorFlow, JAX, or PyTorch as its backend. That gives programmers a useful option: write a model with built-in Keras layers, then choose the backend that fits the rest of the project.
The Keras project states that its API includes more than 100 layers, plus dozens of metrics, loss functions, optimizers, and callbacks. Use that built-in toolkit before writing custom code, because standard components are easier to test and easier for teammates to review.
- Start with a small sequential model for a clear baseline.
- Use a 16-unit ReLU hidden layer for a simple numeric regression experiment.
- Choose mean squared error for continuous targets, then track mean absolute error too.
- Add EarlyStopping so long training runs stop when validation results stop improving.
Keras works well for CNNs, recurrent neural networks, transformers, and structured-data models. It can also read NumPy arrays, Pandas DataFrames, TensorFlow datasets, and PyTorch DataLoaders, which makes it flexible for existing data pipelines.
Use Keras if you want to focus on model design and model evaluation first. Switch to a lower-level TensorFlow or PyTorch training loop when you need unusual batching, custom gradient logic, or research-heavy experiments.
PyTorch: Flexible Deep Learning With Python-First Control
PyTorch is a flexible deep learning framework popular for research, custom training logic, computer vision, natural language processing, reinforcement learning, and large language models. Its eager, Python-first style makes it easier to inspect tensors and debug a model step by step.
Autograd is the feature you will use constantly. It tracks operations on tensors so PyTorch can calculate gradients during backpropagation when you call backward().
In its July 2026 update, the PyTorch Foundation announced PyTorch 2.13. Recent 2.x releases continue to improve compiler tools, distributed training, numerical debugging, and hardware support, so test performance changes against your own model instead of relying on generic benchmarks.
- torch.nn: Build layers, losses, and full neural network modules.
- torch.utils.data.DataLoader: Batch and load training data without hand-writing a loop around every file.
- torchvision: Use image datasets, transforms, and vision models.
- torch.compile: Test compiler acceleration after your eager model is correct.
A useful first project is a binary classifier: turn cleaned feature counts into tensors, feed them through a Linear layer, calculate a binary loss, and write the training loop yourself. That exercise makes the relationship between batches, predictions, losses, gradients, and optimizer steps much clearer.
For custom loss functions, odd batch formats, or research prototypes, PyTorch gives you hands-on control. For deployment, do not rely on old TorchScript examples, because the PyTorch project has deprecated TorchScript in favor of newer export paths.
XGBoost: Gradient Boosting for Tabular Machine Learning
XGBoost is a strong choice for tabular machine learning, especially when your data looks like rows and columns from product analytics, transactions, operations, or business systems. It builds boosted decision trees, often giving you a powerful benchmark before you reach for a neural network.
It supports regression, classification algorithms, ranking, custom objectives, and model interpretation tools. It also learns a branch direction for missing values during tree training, so you do not always need to fill every null before your first baseline.
The XGBoost 3.3 release in June 2026 enabled categorical-feature support by default and added work on distributed GPU training and lower-memory quantile sketching. Still, test category types carefully, because mismatched training and prediction types can cause errors or incorrect behavior.
| Situation | Why XGBoost fits | What to test |
|---|---|---|
| Mixed numeric and categorical columns | Tree models capture nonlinear splits and interactions. | Keep category handling consistent from training through inference. |
| Missing values | Tree boosters learn how to route missing values. | Do not confuse a real zero with a missing value in sparse data. |
| Large CPU training job | Parallel tree building can use available CPU cores. | Limit depth and tune learning rate before adding hundreds of trees. |
| Need feature explanations | TreeSHAP tools can estimate feature contributions. | Check explanations against domain knowledge and validation data. |
Start with a modest baseline, such as 100 trees, a conservative learning rate, and cross-validation. A synthetic run on 200,000 rows with 40 features can use several gigabytes of memory, so watch memory use before scheduling many parallel jobs on a virtual machine.
XGBoost is rarely the right first tool for raw images, audio, or text embeddings without feature preparation. For those problems, use deep learning tools or create useful tabular features first, then compare XGBoost with a scikit-learn baseline.
Final Words
You now have nine Python libraries for machine learning that cover the path from raw data to trained models: NumPy, Pandas, Matplotlib, Seaborn, scikit-learn, TensorFlow, Keras, PyTorch, and XGBoost.
Start with NumPy and Pandas for data preprocessing, use Matplotlib or Seaborn to inspect your data, then build a baseline with scikit-learn or XGBoost.
Bring in TensorFlow, Keras, or PyTorch when deep learning, neural networks, or large language models fit the problem. Track runs with MLflow, compare model evaluation results, and let the data guide your next experiment.