A SaaS company can have product analytics, billing reports, CRM dashboards, and marketing data yet still struggle to answer a basic question: How many customers are actively using the product and paying for it?
The problem is not necessarily bad data. Each system may be counting something different. Product analytics measures users and events. A CRM organizes contacts and accounts. Billing software tracks customers, subscriptions, and invoices. Support tools count conversations and tickets.
All of those numbers can be correct while telling different stories. A SaaS analytics stack connects those stories. It brings product behavior, customer accounts, subscriptions, acquisition, support, and revenue into a system the company can use and trust.
I do not see it as a fashionable collection of data tools. Its purpose is much simpler: help a business move from a question to a reliable answer and then make a sensible decision.
What Is a SaaS Analytics Stack?
A SaaS analytics stack is the connected system a company uses to collect, store, organize, analyze, and act on data from across its product and business.
It commonly brings together information from:
- Product and application events
- The main application database
- Billing and subscription systems
- CRM and sales platforms
- Marketing channels
- Customer-support tools
- Finance or accounting systems
A product analytics platform can be part of this stack, but it is not always the whole stack. Product analytics can explain onboarding progress, feature adoption, funnels, and user retention. It may not explain how those behaviors connect to contract value, renewals, customer acquisition, support activity, or recurring revenue.
The same applies to business intelligence tools. They can present polished reports, but the quality of those reports still depends on the data models and definitions underneath them.
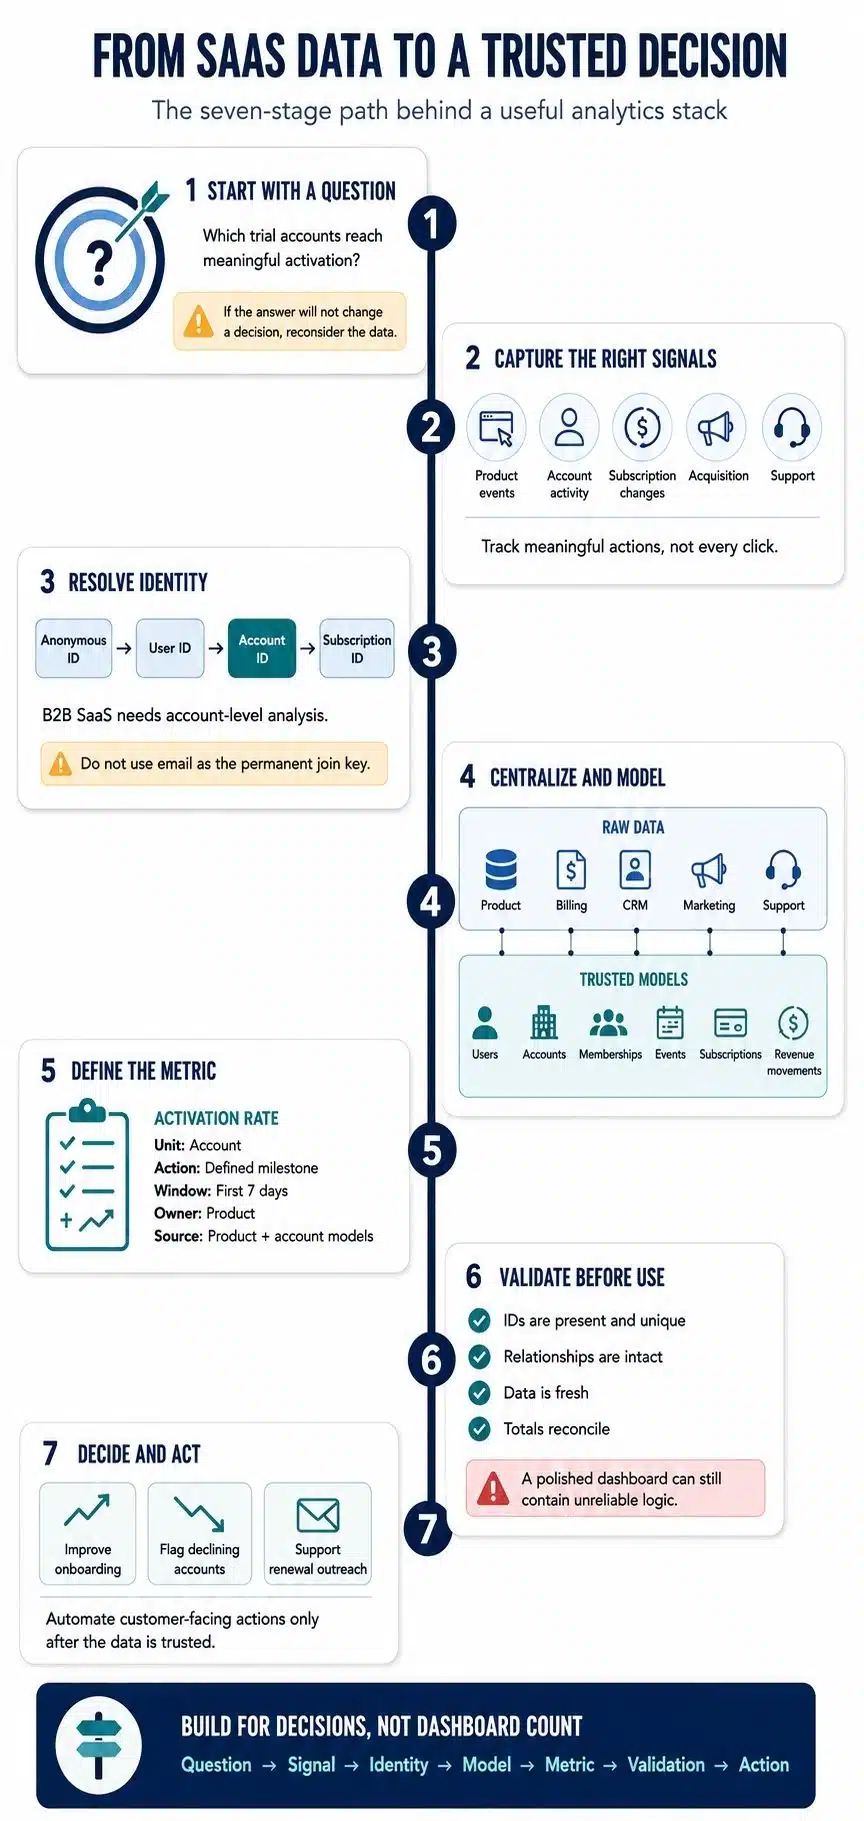
A useful SaaS analytics stack follows a clear path:
Business question → useful signal → source data → reliable model → agreed metric → decision → action
The tools support that process. They should not define it.
What a SaaS Analytics Stack Actually Contains
A company does not necessarily need a different platform for every part of the stack. Some products cover several functions, and smaller businesses can handle multiple layers with a modest database, SQL, and one analytics tool.
However, the responsibilities still need to be understood separately.
Data sources
Data sources are the systems where information first appears.
Product events show what people do inside the application. The application database contains users, workspaces, permissions, and operational records. The billing system knows about plans, subscriptions, invoices, and payments. The CRM stores leads, opportunities, and commercial accounts. Support platforms contain tickets and customer conversations.
No single source contains the complete customer story.
Instead of declaring one platform the source of truth for everything, assign an authoritative source to each entity. The application database may own the user record, the billing platform may own subscription status, and the CRM may own sales opportunities.
This creates clearer ownership when numbers disagree.
Collection and ingestion
The ingestion layer moves data from its original source into the analytics system.
Product activity can arrive through web, mobile, or server-side tracking. Operational database records can be copied through scheduled jobs or change data capture. Billing, CRM, marketing, and support records may arrive through APIs, webhooks, or managed connectors.
Not every pipeline needs to run in real time. A workflow that responds to a customer action may require fresh data within minutes. A weekly management report does not.
Real-time processing should solve a genuine timing requirement. Otherwise, it adds cost and complexity without improving the decision.
Central storage
A data warehouse or lakehouse gives the company a central place to retain and query information from several sources.
It becomes particularly useful when the team needs to connect product usage with billing, marketing, support, or account data. It also allows the company to retain historical records and rebuild reports when definitions change.
An early SaaS company may not need a warehouse immediately. If it has only a few data sources and simple reporting needs, product analytics, billing reports, and lightweight SQL or BI may be enough.
The right time to add central storage is when cross-source questions become frequent, reporting logic is being copied between tools, or historical analysis becomes important. “Other SaaS companies have one” is not a sufficient reason.
Transformation and data modeling
Raw data rarely arrives in a form the business can use directly. Different systems may use different identifiers, timestamps, names, statuses, and levels of detail.
The transformation layer cleans those records and creates dependable models for users, accounts, events, subscriptions, invoices, and other important entities.
This is where an analytics stack either becomes trustworthy or quietly starts producing misleading answers. A polished dashboard cannot repair a poorly designed customer model.
Metrics and reporting
The metric layer defines what the company means by terms such as active account, activation, MRR, expansion, churn, and retention.
A useful metric definition should explain:
- What is being counted
- Whether the unit is a user, account, customer, or subscription
- Which activity or status qualifies
- The reporting period
- The denominator
- Important exclusions
- The authoritative source
- Who owns the definition
This detail matters because billing and analytics platforms may handle trials, discounts, past-due subscriptions, cancellations, and usage-based charges differently.
Larger teams may use a semantic layer to maintain shared definitions across reporting tools. Smaller teams can accomplish the same basic goal with documented SQL models and a carefully maintained metric glossary.
The implementation can be simple. The definitions cannot be vague.
Analysis and activation
Different teams need different ways to explore the data.
Product teams may use funnels, retention cohorts, and feature-adoption reports. Finance may examine recurring revenue movements. Marketing may evaluate acquisition and conversion. Customer success may look for declining account activity before renewal.
There is no reason to force every team into one interface. The more important goal is to prevent each interface from calculating the same metric differently.
Activation takes the process one step further by returning trusted data to operational tools. A company might create a customer-success task when usage declines, send a product-qualified account to the CRM, or trigger onboarding assistance when a trial account becomes stuck.
I would automate those actions only after the underlying identities and definitions have been tested. An incorrect dashboard confuses an internal team. An incorrect automation reaches the customer.
How to Build a SaaS Analytics Stack
The sensible build order begins with business decisions and data definitions. Tool selection comes later.
1. Start with decisions the company cannot make confidently
List the recurring questions that currently create uncertainty. For example:
- Which trial accounts reach the activation milestone?
- Which features are associated with upgrades?
- Which accounts are losing engagement before renewal?
- Which acquisition channels bring retained customers?
- What caused recurring revenue to change this month?
Every question should connect to a decision. If nobody knows what they would do with the answer, collecting more data for it is unlikely to help.
2. Define the important metrics
Choose a small group of company and team metrics that influence real decisions.
Activation shows why this step matters. Signup is easy to count, but it does not necessarily mean a customer has experienced value. A more useful activation metric identifies the action or sequence that represents a meaningful early outcome.
The same care applies to active usage, churn, retention, and recurring revenue. Define the qualifying event, unit of analysis, period, denominator, and exclusions before creating the chart.
Do not begin with every metric the company might need one day. Begin with the ones it needs to operate now.
3. Map the source systems and their owners
Document where users, accounts, subscriptions, invoices, opportunities, campaigns, and support cases live.
For each source, record:
- Its owner
- Its important identifiers
- The history that must be preserved
- The required update frequency
- Privacy restrictions
- Known limitations
This exercise often exposes conflicting definitions and duplicate records before the company buys another platform.
4. Establish identity and time rules
Decide how anonymous activity connects to a registered user and how users connect to customer accounts. Map the internal identifiers to billing and CRM records.
Time needs similar discipline. Keep the time an event occurred separate from the time it was received or loaded. Late-arriving data can otherwise alter funnels, cohorts, and monthly reports without explanation.
The company should also agree on reporting time zones and how it handles delayed financial changes.
5. Create a controlled tracking plan
A tracking plan documents the product events and properties the company intends to collect.
For every important event, define:
- Its name
- The action it represents
- When it should fire
- Where it originates
- Required properties
- Expected data types
- Its business purpose
- Its owner
Consistency is important. “Workspace Created,” “Create Workspace,” and “workspace_created” may look equivalent to a person, but an analytics platform can treat them as three different events.
Start with the activities required to measure onboarding, activation, adoption, conversion, and retention. Tracking every click usually produces more noise, higher costs, and a harder system to maintain.
6. Choose the smallest architecture that answers the questions
A lean SaaS company may begin with product analytics, billing reports, and lightweight business reporting.
A growing company may eventually need event collection, managed ingestion, a cloud warehouse, SQL-based transformations, product analytics, BI, and automated data tests.
A larger or regulated organization may add orchestration, a shared semantic layer, data lineage, pipeline monitoring, detailed access controls, masking, and formal retention processes.
These are possible stages, not required shopping lists. Every tool adds cost, maintenance, ownership, and another potential point of failure.
7. Preserve raw data and build stable business models
Where practical, retain source-aligned data before transforming it. This allows the company to rebuild models when business definitions change.
Then create dependable models for the entities that matter:
- Users
- Accounts
- User-to-account memberships
- Product events
- Account activity
- Subscriptions
- Subscription movements
- Invoices and payments
- Marketing touches
- Sales opportunities
- Support interactions
Subscription movements deserve particular attention. A single current-status field cannot fully explain how recurring revenue changed. Historical analysis may need to distinguish new revenue, expansion, contraction, churn, and reactivation.
History should still be preserved selectively. Storing every version of every record increases ingestion, storage, and processing costs. Keep history where previous states have analytical or regulatory value.
8. Test the data before expanding the reporting
Important data should be tested for:
- Missing or duplicate identifiers
- Broken relationships between entities
- Unexpected status values
- Missing event properties
- Stale sources
- Unexplained changes in record volume
- Failed reconciliation with operational systems
- Historical changes caused by backfills
The company also needs to know who responds when a test fails. An alert without an owner quickly becomes background noise.
Finance should review recurring revenue logic. Product should confirm what tracked events actually mean. Customer success should check whether account signals match recognizable customer behavior.
This review is often more valuable than adding another dashboard.
9. Complete a few valuable use cases
A small set of trusted reports will create more value than a large dashboard library.
A useful first release might include:
- An account activation funnel
- Retention by account cohort
- Feature adoption by plan
- A recurring revenue movement report
- Accounts showing declining usage before renewal
Each output should answer a clear question, identify who uses it, and support a possible action.
10. Activate carefully and review regularly
Once the data is reliable, it can support operational workflows. Begin with low-risk internal actions, such as alerts or tasks, before moving to automated customer communication.
Review the stack periodically. Remove obsolete events, unused reports, broken integrations, and duplicate definitions. Monitor event volume, synced records, storage, compute, seats, and operational maintenance—not just subscription fees.
A smaller system that people understand is more useful than a sophisticated one nobody trusts.
A Trustworthy Stack Starts Smaller Than You Think
A SaaS analytics stack is working when an important number can be traced back to its source, model, definition, and owner, and when someone can use that number to make a better decision.
That does not require the largest warehouse or the longest list of platforms. It requires stable identity rules, a clear account model, disciplined event tracking, tested data, and metrics people understand.
My rule is simple: begin with one important question, identify the data needed to answer it, and build only the layers required to make that answer dependable. Expand when the business develops a real need, not whenever a new analytics category appears.
Frequently Asked Questions About SaaS Analytics Stacks
1. Does every SaaS company need a data warehouse?
No. An early SaaS company with only a few data sources may be able to use product analytics, billing reports, and lightweight reporting. A warehouse becomes more valuable when cross-source analysis, historical reporting, or reusable data models become regular requirements.
2. Can product analytics replace a complete SaaS analytics stack?
Usually not. Product analytics explains behavior inside the product, while a complete stack may also need billing, CRM, marketing, finance, and support data. Some platforms cover several of these functions, but the underlying data responsibilities still remain.
3. Which data sources should a SaaS company connect first?
Start with the application database, the product events needed to measure activation and retention, and the billing system. Add CRM, marketing, and support data when a defined business question requires them.
4. What is the difference between a SaaS analytics stack and a modern data stack?
A modern data stack is the broader technology used to collect, store, transform, govern, and analyze data. A SaaS analytics stack applies those capabilities to SaaS-specific questions involving users, accounts, subscriptions, product adoption, recurring revenue, and retention.
5. How much does a SaaS analytics stack cost?
There is no reliable universal figure. Cost depends on event volume, synced records, warehouse storage and compute, source connectors, refresh frequency, user seats, and the work required to maintain the system. The smallest stack that answers the company’s real questions is usually the safest place to begin.