Website traffic is one of the easiest indicators to measure, but high pageviews do not automatically translate into business growth. A website attracting 10,000 highly targeted visitors who make purchases will always outperform a site attracting 100,000 casual browsers who bounce immediately. When leadership asks how marketing contributes to bottom-line profitability, raw traffic figures fail to provide a complete answer.
To evaluate performance accurately, organizations must focus on important marketing metrics that align directly with revenue generation, operational efficiency, and long-term customer retention. Here are ten essential metrics that reveal the true impact of your marketing efforts.
Revenue and Financial Efficiency Metrics
These metrics connect your promotional investments directly to financial performance and unit economics.
1. Customer Acquisition Cost (CAC)
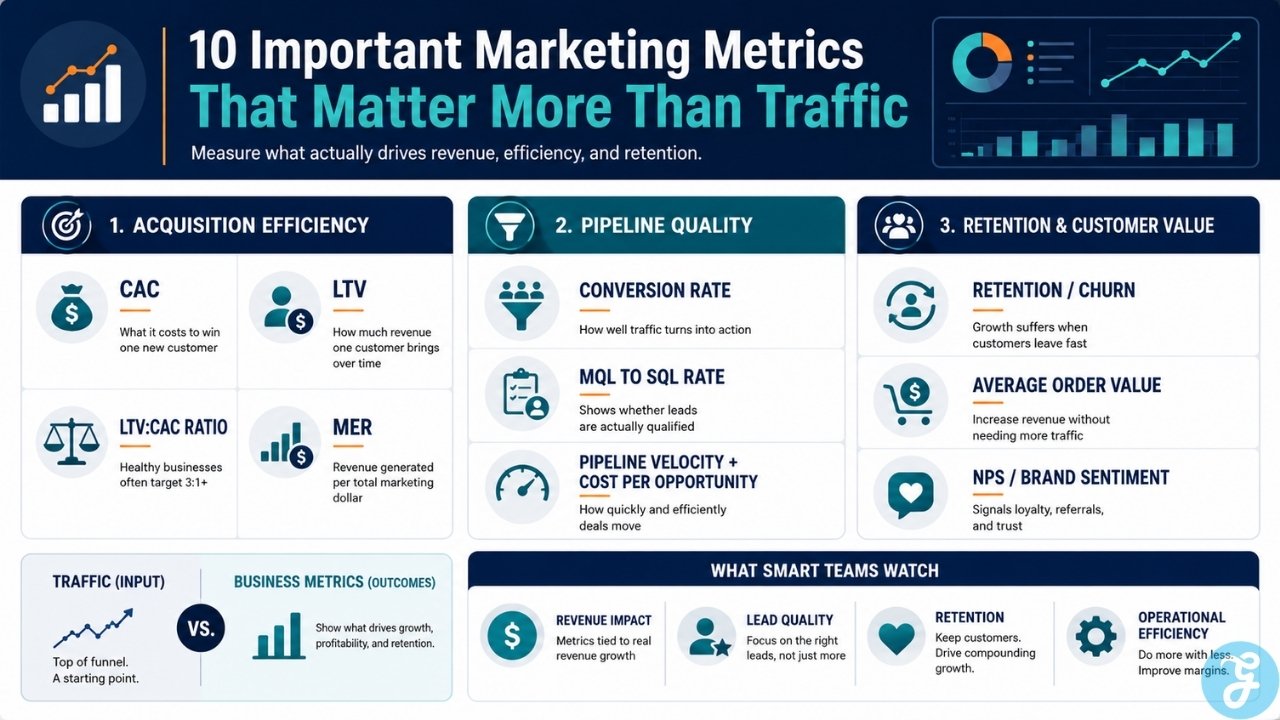
Customer Acquisition Cost measures the total expenditure required to attract a single new paying customer. Calculated by dividing total sales and marketing expenses by the number of new customers acquired over a specific period, CAC reveals whether your growth model is cost-effective. A declining CAC paired with steady acquisition indicates that your targeting and messaging are improving.
2. Customer Lifetime Value (LTV / CLV)
Customer Lifetime Value estimates the total net revenue a single business relationship will generate throughout its active lifespan. Tracking LTV shifts the focus from one-off transactional gains to sustainable, long-term retention. Knowing your average LTV enables you to make informed decisions about how much budget you can safely deploy to acquire new users.
3. LTV to CAC Ratio
While LTV and CAC are valuable individually, comparing them offers a clear view of business sustainability. An ideal LTV to CAC ratio for most growing companies sits at 3:1 or higher, meaning a customer yields three times what it cost to acquire them. A ratio below 1:1 indicates that your marketing strategy is losing money on every new deal, regardless of how much traffic your site receives.
4. Marketing Efficiency Ratio (MER)
Unlike isolated channel Return on Ad Spend (ROAS) figures, which can double-count multi-touch conversions, the Marketing Efficiency Ratio evaluates overall financial efficiency. Calculated by dividing total company revenue by total marketing spend across all channels, MER provides an unfiltered macro view of how effectively your total budget drives revenue.
Pipeline and Conversion Metrics
Attracting visitors is meaningless if those users do not progress through your sales funnel. These metrics measure intent and pipeline health.
5. Conversion Rate (CVR)
Conversion Rate measures the percentage of total site visitors who complete a specific, valuable action, such as signing up for a demo, requesting a quote, or completing a purchase. Optimizing your conversion rate ensures that existing traffic delivers maximum business value before you spend additional capital on scaling acquisition campaigns.
6. MQL-to-SQL Conversion Rate
In lead-generation environments, the Marketing Qualified Lead (MQL) to Sales Qualified Lead (SQL) conversion rate measures lead quality. If marketing generates thousands of top-of-funnel leads that sales teams repeatedly reject, traffic and lead counts remain vanity figures. A high MQL-to-SQL rate confirms that your campaigns attract serious buyers.
7. Pipeline Velocity and Cost Per Opportunity (CPO)
Pipeline velocity measures how rapidly a prospect moves from initial contact to a closed deal. Combined with Cost Per Opportunity (the spend required to generate a fully qualified sales meeting), velocity indicates how effectively your content and campaign messaging overcome purchase friction in the sales cycle.
Retention and Customer Value Metrics
Sustained growth relies heavily on expanding value within your existing customer base rather than continuously replacing lost accounts.
8. Customer Retention and Churn Rate
Customer Churn Rate tracks the percentage of users or subscribers who cancel their contracts within a given timeframe. Conversely, Customer Retention Rate indicates account stability. High traffic numbers cannot compensate for a high churn rate; retaining existing clients costs significantly less than acquiring new ones.
9. Average Order Value (AOV)
Average Order Value tracks the average monetary amount spent every time a customer places an order. Increasing your AOV through strategic upselling, product bundling, or cross-selling allows your business to boost total revenue significantly without requiring any increase in web traffic.
10. Net Promoter Score (NPS) and Brand Sentiment
Net Promoter Score measures customer satisfaction and advocacy by asking how likely users are to recommend your product or service to others. High NPS scores correlate directly with organic referral growth, higher retention, and reduced acquisition costs, making customer sentiment a powerful forward-looking growth indicator.
What to Avoid: Limitations and Trade-Offs
Shifting focus to outcome-based metrics requires avoiding common analytical mistakes.
Ignoring Channel-Specific Context
Applying uniform target metrics across every channel creates unrealistic benchmarks. Brand-building initiatives like video series or podcasts will naturally yield lower immediate conversion rates than paid search campaigns, yet they build the trust that powers downstream conversions.
Siloed Metric Ownership
Isolating marketing metrics from sales and customer success data obscures the true buyer journey. If marketing measures success strictly by leads while sales measures success by deal size, internal misalignment inevitably occurs. Teams should share pipeline and revenue goals.
Over-Complicating Dashboard Tracking
Tracking dozens of competing data points leads to analysis paralysis. Select two or three core metrics per funnel stage to maintain clarity and ensure that team meetings focRus on actionable decisions rather than overwhelming spreadsheets.
Final Thoughts
Evaluating campaign success through important marketing metrics like CAC, LTV, conversion rates, and pipeline velocity gives organizations a clear, accurate understanding of business performance. While traffic helps measure top-of-funnel reach, focusing on revenue-aligned metrics ensures your marketing strategy delivers sustainable profitability and long-term customer growth.
Frequently Asked Questions on Important Marketing Metrics
Why is website traffic considered a vanity metric?
Traffic is considered a vanity metric when measured in isolation because high visitor counts do not guarantee sales, leads, or revenue. A site can receive massive traffic without generating business value if those visitors lack buying intent.
How do I calculate Customer Acquisition Cost (CAC)?
Calculate CAC by taking your total sales and marketing expenses over a given period (including ad spend, software, and salaries) and dividing that total by the number of new customers acquired during that same time frame.
What is a good LTV to CAC ratio?
A healthy LTV to CAC ratio for most established business models is 3:1 or higher. This indicates that a customer generates three times more lifetime value than the financial cost incurred to acquire them.