

Have you spent hours chasing bugs in your code? Every new line of code can hide a software bug, slowing down code troubleshooting. We show five habits that cut coding errors, speed up error handling, and tame log files in your integrated development environments.
Keep reading.
Key Takeaways
- Use short, single-purpose functions and clear names. Run a linter plugin in your IDE. Write a docstring or comment per function. Split complex logic into blocks and test each block. This cuts errors and speeds debugging.
- Make small Git commits. Craft clear messages with ticket IDs. Spin off feature and fix branches. Test on merge only after tests pass. Maintain a changelog with versions, dates, and key changes (per Andrew Hunt and David Thomas). Prune stale branches. Link your IDE, Git, and online host.
- Separate access and error logs. Use structured fields like timestamps, severity, and user IDs. Send logs from your IDE console, system logger, and AWS CloudWatch to a search platform. Rotate logs daily or use MongoDB 3.0 fixed-size record store. Include function names and line numbers in error messages.
- Use GNU Debugger (gdb) for C and Python Debugger (pdb) with c, n, and s commands. Use browser dev tools to debug JavaScript. Use VS Code and JetBrains IDE debuggers to set breakpoints, watch variables, and view call stacks. Do rubber duck debugging and keep a bug journal with dates, messages, and fix steps.
- Write unit tests that cover edge cases before release. Run end-to-end tests in a CI runner and use one-click test runs in modern IDEs. Spot slow loops and performance issues early. Frequent tests build reliability, catch errors, and cut debugging time.
How can I write clean and readable code?
Clean code starts with clear names and simple layout. Short functions focus on one idea. Use consistent indentation and spacing. Use a linter plugin in your IDE. Clear names make error handling easy.
Modules group related steps. Teams read code faster. Cleaner code cuts software development risk.
Write a docstring or comment on each function. It helps in code troubleshooting. Split complex logic into small blocks. Test each block with sample data. This cuts coding errors and isolates code sections.
You use a debugger tool in your IDE to step through the code. It logs each bug fixed right away. This debugging process finds and fixes software bugs faster. Developers face less frustration when code stays tidy.
Practice ruthless testing on these chunks before release.
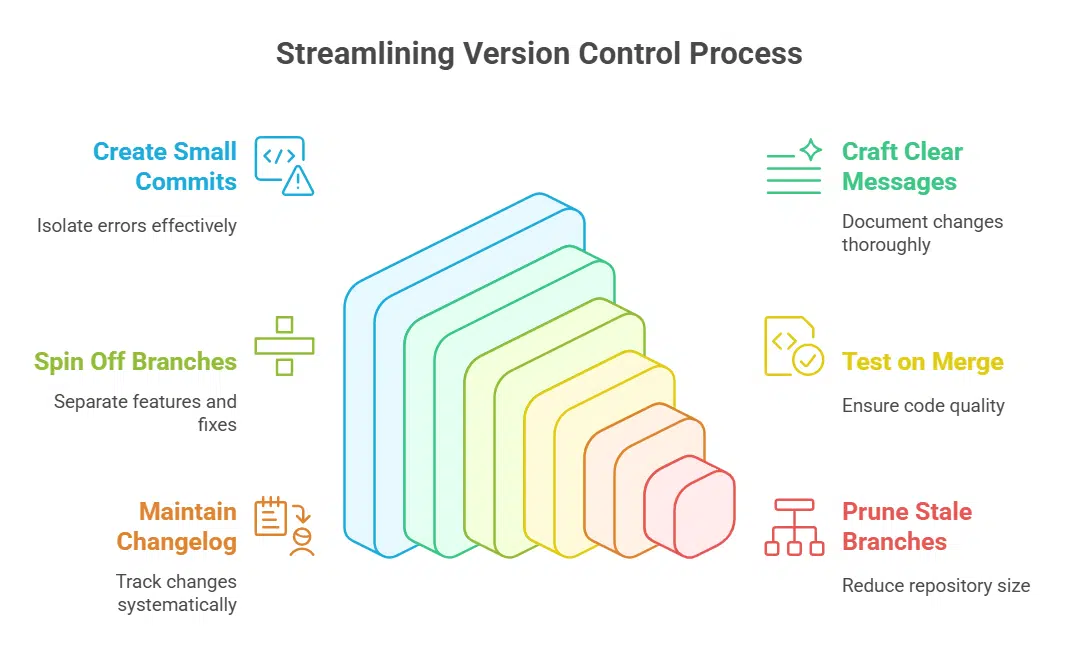
How do I use version control effectively?
Version control feels like a time machine. It tracks code changes and bug fixes.
- Create small commits. This helps isolate coding errors. You can track each fix in your computer program and analyze regressions.
- Craft clear messages. Include ticket IDs and notes on error handling. A log entry maps your coding journey step by step.
- Spin off branches. Keep features and bug fixes out of each other. This practice protects program flow and cuts merge conflicts.
- Test on merge. Run test suites before you apply changes to main. You catch software bugs and vulnerabilities early.
- Maintain a changelog. List version numbers, dates, and key changes. Andrew Hunt and David Thomas warn that miscommunication costs time and trust.
- Prune stale branches. Remove old code paths to shrink your repo and cut risk. A lean repo helps your version tracker stay fast.
- Connect your IDE, your version tracker, and your online code host. Activate debugging tools in your IDE for smooth code troubleshooting and a clear debugging process.
How do I implement comprehensive logging?
Good logs catch sneaky software bugs fast. You can dodge hours of code troubleshooting with smart error handling.
- Categorize logs into access records and error records so you track normal operations and crashes.
- Use structured fields like timestamps, severity, and user IDs for better search and error tracing.
- Push logs from the IDE console, system logger, and CloudWatch into a search platform for alerts and trend spotting.
- Rotate logs daily or use the fixed-size record store feature in MongoDB 3.0 to overwrite old entries, thin the pile.
- Add clear error handling messages that mention function names, line numbers, and common coding errors.
Master debugging tools and techniques
I set breakpoints in Microsoft’s code editor, then step through each line with a watch expression. I tweak flags in GNU’s debugger and scan live states in my browser console, like a detective on a trail.
What are the best debugging tools to use?
We pick the best tools to hunt down software bugs fast. These debugging tools help you pause code, watch variables, and fix coding errors.
- GNU Debugger for C lets you pause code at breakpoints. It offers c to continue, n to next line, s to step inside functions. This tool inspects variables and fights coding errors.
- Python Debugger runs in your console. Import it into code right before a bug. Its c, n, s commands move you through code. It speeds up code troubleshooting and improves error handling.
- Browser developer tools handle JavaScript bugs. Each modern browser packs this suite. Breakpoints let you stop at a line. They speed up the debugging process in web software development.
- Visual Studio Code debugger brings tools into your editor. Clicking a margin sets a breakpoint. It taps built in features of integrated development environments to show variables and call stacks. Stack frames appear in a log panel to trace error flows.
- JetBrains IDE debugger adds deep runtime views. Many JetBrains apps, like PyCharm, share this feature. You can attach to a live process and inspect variables. The panels chart the debugging process and uncover software bugs.
How can I improve my debugging techniques?
Bugs can hide in plain sight. Good tactics cut debugging time.
- Inspect error messages in the console or logs to speed up code troubleshooting. They tell you file name, line number, and stack trace. A SyntaxError pop up in Chrome DevTools often points to a missing parenthesis.
- Reproduce each fault step by step inside your IDE. Run the scenario, note the inputs, and recheck the output. That clear record helps you isolate coding errors.
- Scan server or app logs for repeating patterns in error handling. Use a log analyzer or basic text search to track down null pointer exceptions. A string of errors at the same time stamp often reveals an upstream bug.
- Talk through the code to a desk toy or partner, a form of rubber duck debugging. This old trick breaks your tunnel vision so you spot odd logic fast.
- Write test scripts that cover edge cases before code hits production. A simple unit test catches off by one errors early. It’s a core part of any thorough testing plan.
- Mark breakpoints in integrated development environments (IDEs) like VS Code or PyCharm, two top debugging tools. Step into loops and inspect variable states as you go. This key step in the debugging process is a staple of modern software development.
- Keep a bug journal with dates, tools, error messages, and fix steps. After a few weeks you’ll see patterns in your coding journey, auto save mishaps or memory leaks.
- Step back and map how modules talk to each other. A small change in one function can ripple across the system. Seeing the big picture stops local fixes from triggering new software bugs.
Why should I test my code frequently and thoroughly?

Frequent testing catches coding errors before they sneak into live code. It boosts performance and cuts waste by spotting slow loops early. End-to-end trials run in a popular continuous integration runner, they spot flaws under real loads.
Debugging tools like loggers show you the root cause fast. Modern integrated development environments (IDEs) let you launch tests in one click. Ruthless testing fires off stacks of checks before you ship new code.
Along your coding journey, tests keep you on track. Thorough checks catch edge cases that slip past watch. This builds reliability and wins user trust. It smooths operation so features run more reliably, and it forms a safety net for easier updates.
Tests trim the debugging process and keep software bugs from holding you up. You save hours in code troubleshooting and cut time in error handling.
How do I document my code clearly?
Clear comments help you learn from past errors and avoid repetition. Each function needs a short note at its start. Use inline comments to flag error handling. Write module guides in Markdown.
A doc generator can turn notes into pages. IDEs let you link comments to debugging tools, so you read docs when you step through code. Good guides speed up code troubleshooting and keep your coding journey on track.
Outline any bug fix, record the test steps, and include screenshots. Chat with testers, set up a call if they work remote. Ask for full details on software bugs and the expected result.
Add that note to the doc so you can avoid repeating mistakes. After you merge a change, check that the tester agrees on the new behavior. That step closes the loop in your debugging process and it saves you hours later.
Takeaways
These five habits act like a map, guiding you past software bugs. You write clean code, track changes with a version control system, and log vital data. Your integrated development environment and debugger show bugs in code, so you fix them fast.
Test cases spot edge issues, and solid error handling stops surprises. Embrace these steps, and you will spend more time coding features, and less time troubleshooting.
FAQs on Coding Habits to Minimize Debugging Time
1. How can good coding habits reduce software bugs and coding errors?
I keep each function small. This way I spot coding errors early. I recall my first coding journey. It was messy like a puzzle, but this trick tamed the chaos.
2. Which tools help in fast code troubleshooting?
I lean on debugging tools in integrated development environments ( IDES ). They feel like a trusty sidekick, pointing at lines that misbehave. It cuts the debugging process in half.
3. What makes strong error handling key?
A solid error handling plan acts like a safety net. It gives clear alerts when data trips up. You fix flaws before they stack up in your software development.
4. Why set up shortcuts in my IDE?
Shortcuts keep your hands on the keyboard, they trim steps in code troubleshooting. You jump between files in a blink. It makes saving time feel like magic.