
Building marketing reports manually is a drain on time, energy, and accuracy. If you are still copying and pasting data from Google Analytics, Meta Ads, and your CRM into a spreadsheet at the end of every month, you already know the pain.
The right reporting tool automates data extraction, standardizes metrics across platforms, and visualizes performance in a way clients and stakeholders actually understand. However, the software landscape shifts constantly. Pricing models change, features get locked behind higher tiers, and what worked perfectly last year might be pricing you out this year.
Here is a comprehensive breakdown of the 10 best tools for building marketing reports, helping you find the exact fit for your workflow and budget.
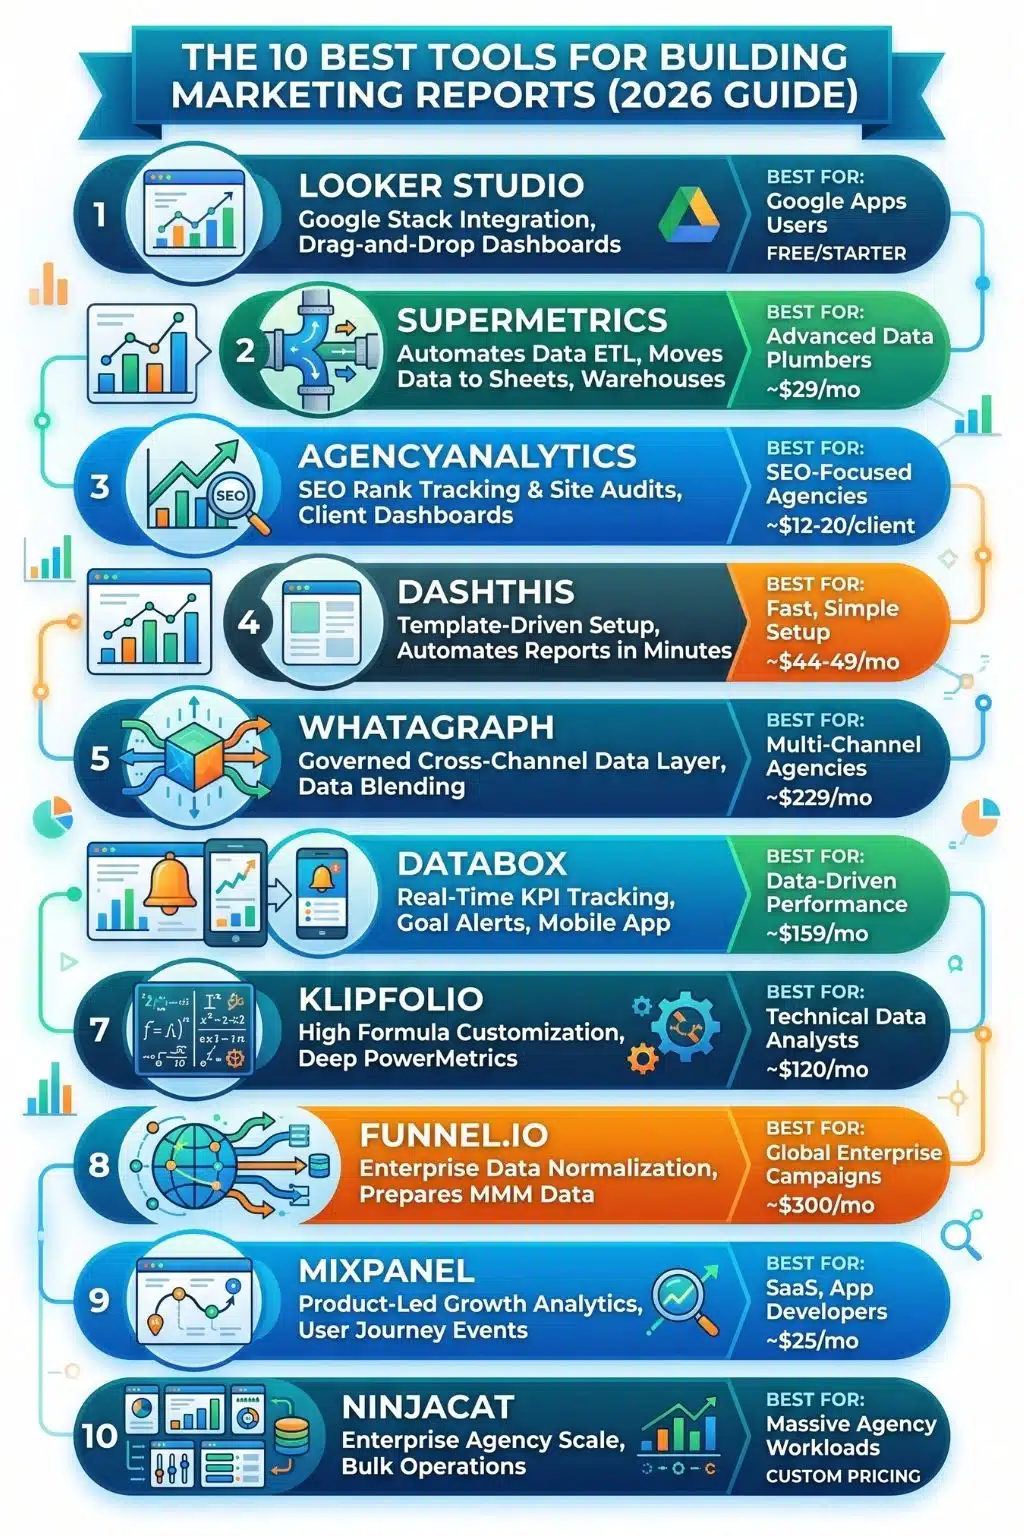
Top Marketing Reporting Tools at a Glance
| Tool | Best For | Starting Price | Core Capability |
| 1. Looker Studio | Google-stack users | Free | Drag-and-drop custom visual dashboards |
| 2. Supermetrics | Data extraction | ~$29/mo | Moving data to Sheets, BigQuery, BI tools |
| 3. AgencyAnalytics | SEO & full-service agencies | ~$12–$20/client/mo | Per-client pricing with built-in SEO tools |
| 4. DashThis | Fast, simple setups | ~$44–$49/mo | Template-driven, automated reports |
| 5. Whatagraph | Data consolidation | ~$229/mo | Cross-channel governed data layer |
| 6. Databox | Real-time KPI tracking | ~$159/mo | Goal tracking, alerts, and mobile access |
| 7. Klipfolio | Technical analysts | ~$120/mo | Deep formula-driven metric customization |
| 8. Funnel.io | Enterprise pipelines | ~$300/mo | Data normalization before visualization |
| 9. Mixpanel | Product marketing | ~$25/mo | User journey and retention analysis |
| 10. NinjaCat | Enterprise agencies | Custom | Massive scale and bulk account operations |
Filter and evaluate the tools based on your specific needs using this interactive matrix.
1. Looker Studio (Formerly Google Data Studio)
Looker Studio remains the undisputed starting point for anyone moving away from manual spreadsheets. Because it is part of the Google ecosystem, it integrates flawlessly, and freely, with Google Analytics, Google Ads, and Search Console.
- The Reality Check: It provides a flexible, drag-and-drop canvas, but it does not come with its own database. You are relying on live data calls, which can cause dashboards to load incredibly slowly if they are widget-heavy. During testing, pulling multiple months of historical data caused noticeable lag.
- Starting Price: Free. A Pro tier is available for advanced project management.
2. Supermetrics
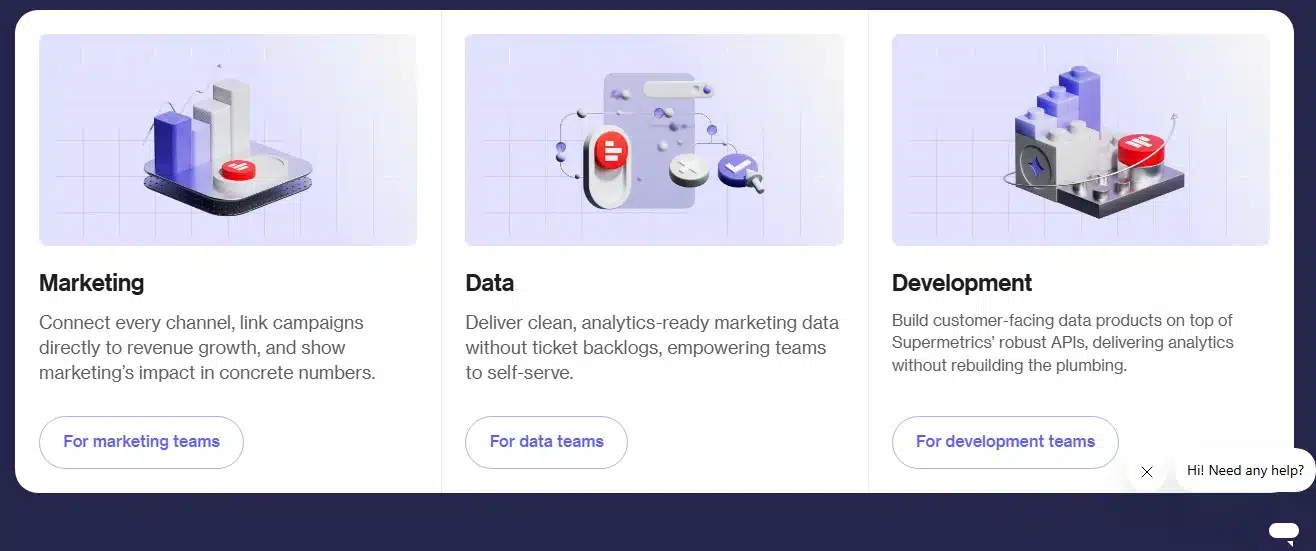
Supermetrics is not a standalone dashboard builder; it is the industry standard for data extraction. It solves the “plumbing” problem of marketing by pulling data from over 100 sources directly into Google Sheets, Excel, Looker Studio, or data warehouses like BigQuery.
- The Reality Check: You still have to build the actual reports yourself in your destination tool. It is strictly for data movement. If you just need quick visual dashboards, this isn’t it, look at DashThis instead.
- Starting Price: Starts at around $29/month for the Starter plan (billed yearly).
3. AgencyAnalytics
Built specifically around the agency-client relationship, AgencyAnalytics offers white-labeled dashboards, client user logins, and automated report delivery. It includes built-in SEO tools like rank tracking and site audits, saving you from buying separate SEO software.
- The Reality Check: They operate on a per-client model, typically costing around $12 to $20 per client per month. While affordable if you only have five clients, the costs compound quickly as your agency scales past 50 clients.
- Starting Price: Scaled per client, starting roughly between $12 to $20/client/month.
4. DashThis
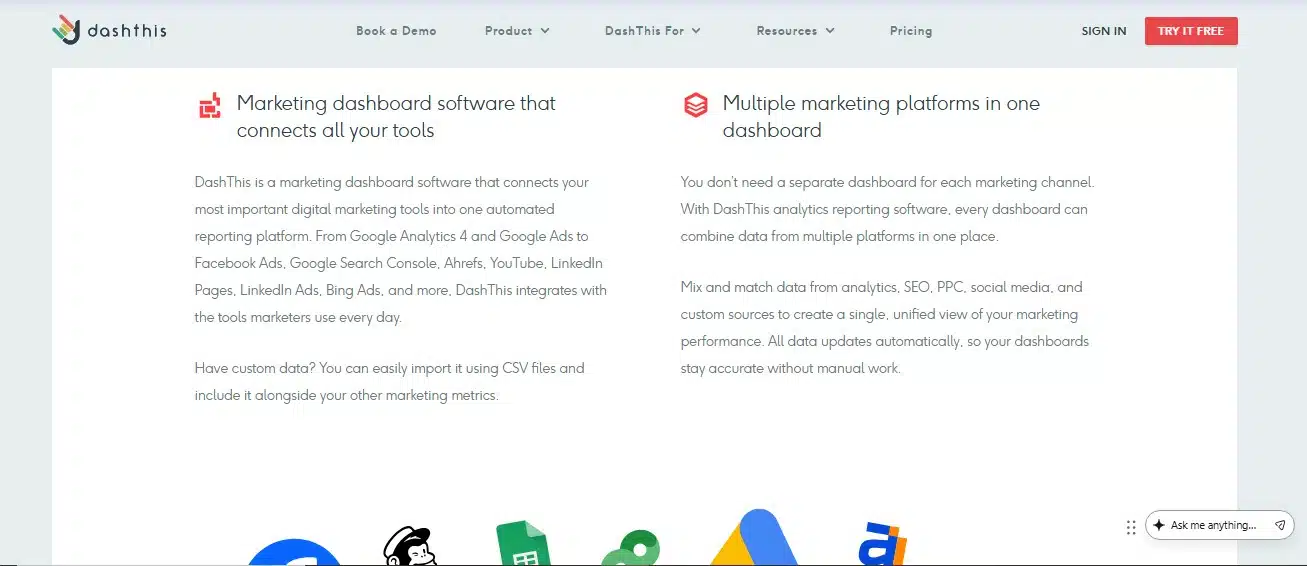
DashThis prioritizes speed and simplicity over deep data transformation. If you need professional, automated reporting without a learning curve, this is a top contender. It comes with excellent pre-built templates that let you launch a dashboard in minutes.
- The Reality Check: It is designed for straightforward visualization. If you need to write complex custom formulas or blend obscure data points, it will feel restrictive. For deep customization, you’d need a tool like Klipfolio.
- Starting Price: Volume-based pricing starting around $44 to $49/month for your first 3 dashboards.
5. Whatagraph
Whatagraph acts as an all-in-one data layer and visualizer. When we tested connecting Meta Ads and GA4, we loved how easily it blended sources and standardized naming conventions, like combining Meta and Google Ads data into a single “Total Ad Spend” metric, without writing code.
- The Reality Check: They have shifted upmarket with a source-based custom pricing model. Your costs scale based on how many data sources you connect, making it a premium choice better suited for mid-sized agencies.
- Starting Price: The Start plan begins at roughly $229/month (billed annually) for 20 source credits.
6. Databox
Databox focuses heavily on real-time performance tracking rather than just end-of-month reporting. It features goal tracking, anomaly alerts, and a strong mobile app so you can check your KPIs on the go.
- The Reality Check: Databox transitioned to a per-source pricing model. If you have clients with highly fragmented, multi-channel marketing stacks (10+ integrations), the costs add up fast.
- Starting Price: The Pro plan starts at approximately $159/month (billed annually).
7. Klipfolio
Klipfolio caters to data-savvy analysts who find standard dashboard tools too rigid. Through its PowerMetrics feature, it allows for deep, formula-driven customization and complex data manipulation.
- The Reality Check: There is a steep learning curve. It is built for technical teams who want absolute control over how their metrics are calculated and displayed. It is not recommended for a quick setup.
- Starting Price: Around $120/month.
8. Funnel.io
Funnel is an enterprise-grade data hub that normalizes massive amounts of fragmented marketing data before passing it to a business intelligence (BI) tool. It automatically handles messy tasks like currency conversion and metric standardization.
- The Reality Check: Like Supermetrics, Funnel requires a separate visualization tool. It is overkill for small businesses but a lifesaver for global enterprises managing complex, multi-currency campaigns. For a simpler setup, DashThis is the way to go.
- Starting Price: Usage-based pricing starting around $300/month.
9. Mixpanel
While not a traditional campaign reporting tool, Mixpanel is essential for product-led growth. It focuses on user behavior post-click, offering advanced event tracking, funnel analysis, and retention monitoring.
- The Reality Check: It is built for product marketing and app development, not for top-of-funnel ad campaign reporting. If you need to show Meta ROAS, this isn’t the tool.
- Starting Price: Generous free tier; paid plans start at $25/month.
10. NinjaCat
NinjaCat is built strictly for scale, handling data pipelines for franchises and massive enterprise agencies. It allows for bulk operations across hundreds of accounts simultaneously.
- The Reality Check: It is a heavy-duty platform requiring proper onboarding and setup. It is completely inaccessible (and unnecessary) for freelancers or small teams.
- Starting Price: Custom enterprise pricing.
Building a Data-Driven Culture That Works
Choosing the right reporting tool isn’t just about finding the cheapest software or the most colorful charts. It is about removing the friction between raw data and actionable insights. Whether you need the plug-and-play simplicity of DashThis or the raw extraction power of Supermetrics, the best tool is the one that gets your team out of spreadsheets and back into actual marketing strategy. Evaluate your data sources, outline your budget, take advantage of the free trials, and start automating your growth.
Frequently Asked Questions About Marketing Reporting Tools
1. Should I use Looker Studio or pay for a dedicated reporting tool?
If 90% of your data lives in Google Analytics and Google Ads, Looker Studio is more than enough. However, the moment you need to blend in data from Meta, LinkedIn, TikTok, or your CRM, you will need to pay for a third-party connector (like Supermetrics) anyway. At that point, a dedicated tool often provides a smoother, faster experience.
2. What is the difference between an ETL tool and a dashboard tool?
ETL (Extract, Transform, Load) tools like Supermetrics and Funnel.io strictly move your data from a platform (like Facebook) into a destination (like Google Sheets). They do not create pretty charts. Dashboard tools like DashThis or AgencyAnalytics pull the data and instantly format it into visual, client-ready reports.
3. Are per-client or per-dashboard pricing models better?
It depends entirely on your business structure. If you are an agency that charges high retainers to a few clients, per-client pricing is excellent. If you are scaling a volume-based business with dozens of small accounts, per-dashboard or per-source pricing will likely save you thousands of dollars a year.
4. How can I ensure my clients actually read these reports?
Keep it simple. Stop sending 20-page PDFs filled with vanity metrics. Use tools that allow for an executive summary at the top, focusing strictly on exactly what the client cares about: Leads generated, Cost Per Acquisition (CPA), and Return on Ad Spend (ROAS).
5. Do these tools slow down my website?
No. Marketing reporting tools pull data via APIs from platforms like Google Analytics or Meta. They do not add any extra code or scripts to your live website, so your page load speed is completely unaffected.