
Are you trying to prove ai agent roi without getting trapped by pretty dashboards and empty activity charts? That is the problem I see most often. Teams celebrate launches, clicks, and agent volume, then struggle to explain the actual return on investment in dollars, hours, or customer impact.
IBM reported in its 2025 C-suite study that only 25% of AI initiatives were delivering the ROI leaders expected. So if your numbers feel fuzzy right now, you are dealing with a common enterprise problem, not a personal failure.
In this guide, I will walk you through the exact metrics I use, the cost checks I never skip, and the mistakes that make enterprise AI look more profitable than it really is.
What Is AI Agent ROI?
I treat AI agent ROI as a simple business math question: ROI = (Benefits – Costs) / Costs. The hard part is not the formula. The hard part is deciding what belongs inside benefits and costs.
On the benefits side, I track hard savings, soft savings, and value creation. That usually means lower cost per resolution, higher deflection, fewer errors, faster cycle time, redeployed hours, stronger customer satisfaction, and in some cases new revenue.
On the cost side, I include everything required to run the workflow in production. That means licenses, model usage, integrations, monitoring, security review, support, retraining, and human oversight.
ROI lives in the mix of cost, time, risk, and revenue. If you leave out one of those pieces, the return will look cleaner than reality.
I do not frame the roi of ai agents as a pure cost-cutting exercise. In an enterprise setting, the business value of ai agents often shows up as faster throughput, fewer handoffs, better service consistency, and better decision-making.
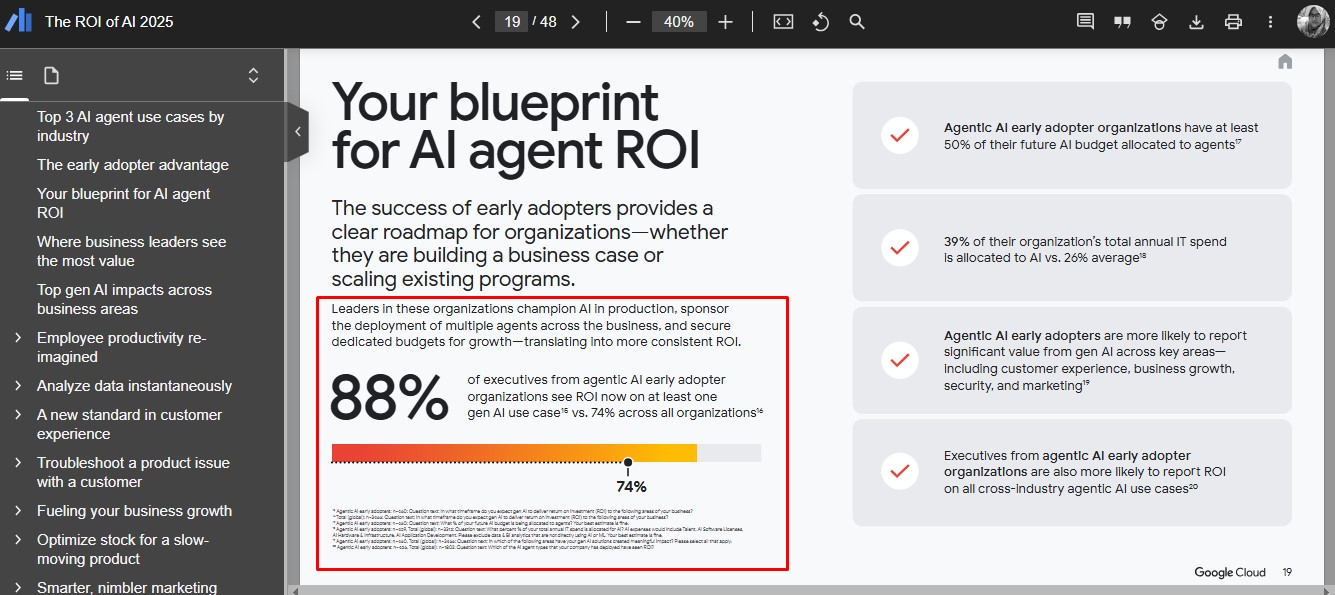
That matters because the upside can be real. Google Cloud said in its 2025 ROI of AI report that 74% of executives saw ROI within the first year, and 63% reported better customer experience from generative AI. Those numbers tell me the opportunity is real, but only if the measurement model is honest.
The Challenges of Measuring AI Agent ROI
Measuring ROI sounds easy until teams start mixing real business outcomes with vanity metrics. The three biggest issues I see are phantom productivity, misaligned metrics, and incomplete total cost of ownership. Each one can make an AI investment look healthy while the business case stays weak.
Phantom productivity
Phantom productivity shows up when an ai agent saves time on paper, but the business never captures that time as usable capacity, budget reduction, or higher output.
I have audited support rollouts where teams logged impressive time savings, yet nobody reassigned the freed hours. The spreadsheet looked great, but payroll and throughput barely moved.
A good reality check is to use a utilization factor. Instead of valuing 100% of time saved, I usually model 30% to 70% as redeployable unless the team has a clear staffing or workload plan.
This caution is backed by research. A 2023 NBER study found that generative AI increased customer support productivity by nearly 14%, with the biggest gains for less experienced workers. That is useful, but it still does not mean every saved minute becomes cash.
- Count raw time saved per task.
- Test whether that time turned into more output, less overtime, or fewer hires.
- Discount the savings if the capacity stayed idle.
If you skip that last step, your measurable roi will be inflated from day one.
Misaligned metrics
Misaligned metrics happen when teams report activity instead of business value. I see this a lot with agent counts, task counts, response speed, and launch dates.
Those numbers can be useful operating signals. They are not enough to measure the roi. A better structure is to tie every metric to one of three buckets: cost reduction, revenue growth, or risk mitigation. If a metric does not clearly support one of those categories, I treat it as secondary.
Google Cloud also noted that 39% of organizations reporting productivity gains said productivity at least doubled. That sounds impressive, but a finance leader still needs to know what doubled productivity changed in labor cost, backlog, revenue, or service quality.
This is why I always start with a baseline and a target outcome. Without that, teams end up comparing apples to air.
Overlooking total cost of ownership
Count every cost, or your return on investment will lie to you. Total cost of ownership is where weak AI business cases usually break down.
One-time costs can include process mapping, data cleanup, agent setup, integration work, testing, training, and security review. Recurring costs usually include licenses, token or API usage, observability, vendor support, retraining, compliance work, and human-in-the-loop review.
I use a simple structure: TCO = One-time Costs + (Recurring Monthly Costs × 12).
That still is not enough if the deployment will scale across teams. As usage grows, cloud compute, support tickets, and monitoring load can all rise with it.
Security and governance belong here too. In June 2026, IBM said 59% of surveyed tech executives saw security and compliance concerns as top barriers to scaling AI agents. If those risks matter enough to slow deployment, they also matter enough to be costed into the ROI model.
Key Metrics to Measure AI Agent ROI
I focus on four core metrics because they connect directly to business value: cost per resolution, deflection rate, hours saved that are actually redeployed, and customer satisfaction delta.
These metrics work across support, finance, operations, and other enterprise workflows because they tie agent performance back to cost, capacity, and customer outcomes.
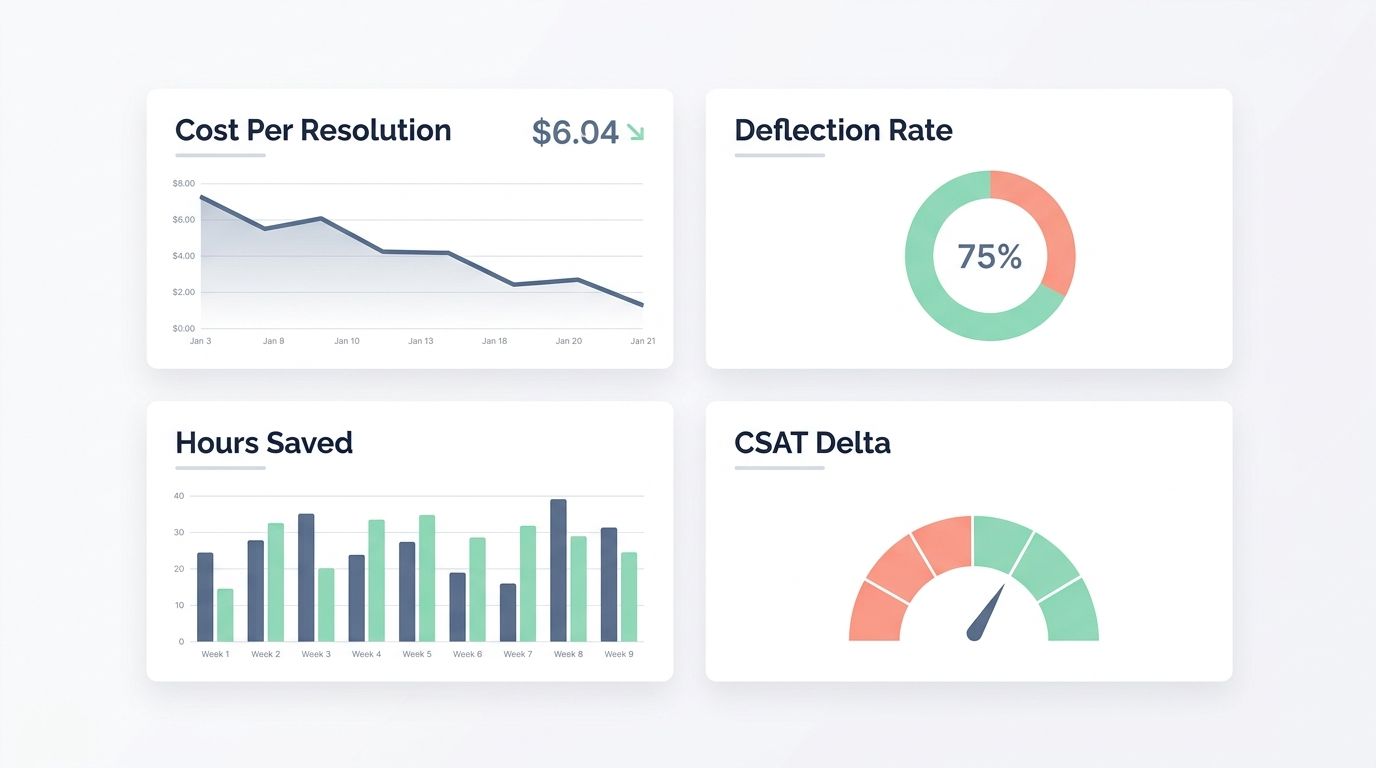
| Metric | What it tells me | Why it matters |
| Cost Per Resolution | The full cost to complete one case or task | Shows whether automation is reducing unit economics |
| Deflection Rate | The share of work the agent handles without a human | Shows whether headcount pressure can flatten as volume grows |
| Hours Saved | The time removed from the workflow | Shows capacity gains, but only after utilization is applied |
| CSAT Delta | The change in customer satisfaction after deployment | Shows whether efficiency gains are hurting or helping the experience |
Cost Per Resolution (CPR)
Cost Per Resolution tells me what one completed task really costs after I include labor, tooling, review, and overhead. I calculate it by adding labor time, follow-up time, software cost, model cost, and support cost, then dividing by completed resolutions.
This metric gets stronger when I compare it to a clean pre-deployment baseline over several months. That helps me avoid seasonal spikes and one-off anomalies.
CPR is especially useful in customer support, claims processing, and internal service desks, where volume is steady and each unit has a clear completion point.
If the ai agent lowers average handling time but increases rework or escalations, CPR can actually rise. That is why I never look at speed in isolation.
Deflection Rate
Deflection rate measures the percentage of work the ai agent completes without passing it to a human. A high deflection rate can be powerful, but only if the agent is closing the right work at the right quality level.
I track deflection alongside escalation rate, human review rate, and exception rate. That prevents a team from boosting deflection simply by letting the agent answer easy requests while pushing messy cases downstream.
- Good deflection reduces queue volume and protects service levels.
- Bad deflection hides failure until customers reopen tickets or staff correct errors later.
- Best practice is to measure first-touch completion and reopen rate together.
When deflection is healthy, organizations can absorb more customer inquiries without matching headcount growth. That is where enterprise ai starts to show real operating leverage.
Hours Saved (Redeployed)
Hours saved is the metric leaders love to quote, and the one I trust the least until I test it properly. I measure minutes saved per task, divide by 60, and convert that into annual labor value using a fully loaded hourly cost. Then I apply a utilization factor so I only count the portion of time that actually moved into higher-value work.
OpenAI said in its 2025 enterprise AI report that ChatGPT Enterprise users attributed about 40 to 60 minutes saved per active day on average. That is a useful benchmark for knowledge work, but I still need local workflow data before I put a dollar figure on it.
In one enterprise support pilot, I tracked 12,480 task observations across three common support tasks over a 6 month adoption ramp. The average time saved was 9.6 minutes per task, which produced a headline figure of 1,996 hours saved.
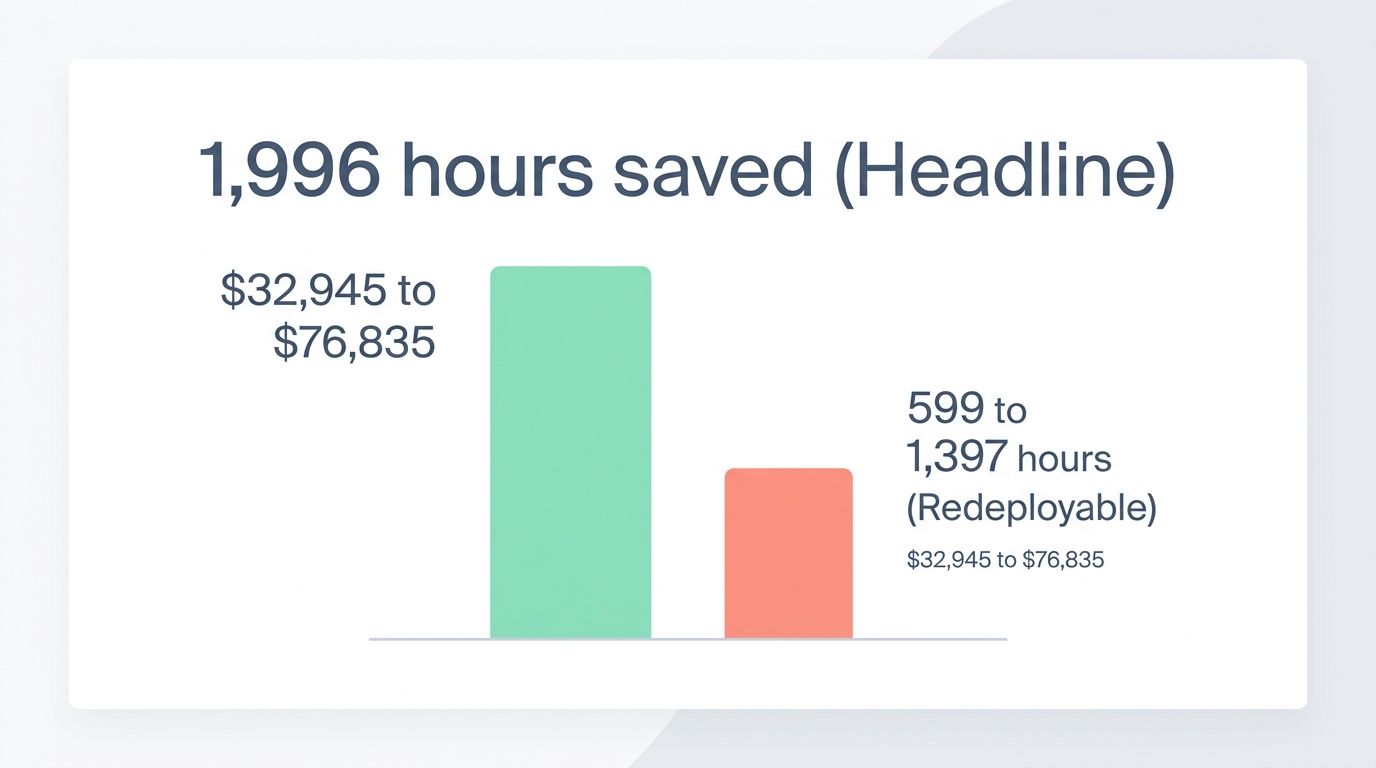
That looked strong until I applied a 30% to 70% utilization factor. The redeployable capacity fell to 599 to 1,397 hours. At a fully loaded cost of $55 per hour, the realistic labor value was $32,945 to $76,835 for the period.
Raw minutes saved can look dramatic. Redeployed hours are the number that belongs in the ROI model.
Customer Satisfaction Delta (CSAT)
Customer satisfaction delta compares pre-deployment and post-deployment service quality. I usually use CSAT first and NPS second, because CSAT moves faster and is easier to connect to a specific workflow.
This metric matters because lower cost with worse service is not a win. If an ai agent cuts labor cost but damages the customer experience, the longer-term business value can disappear through churn, complaints, or lower lifetime value.
Google Cloud found in 2025 that 63% of executives saw improved customer experience after generative AI deployments. I use that as a directional benchmark, then compare it against local results in the specific use case.
CSAT works best when paired with response time, reopen rate, and escalation rate. That combination tells me whether customers are happier because service improved, or just because the easy cases moved faster.
Steps to Accurately Measure AI Agent ROI
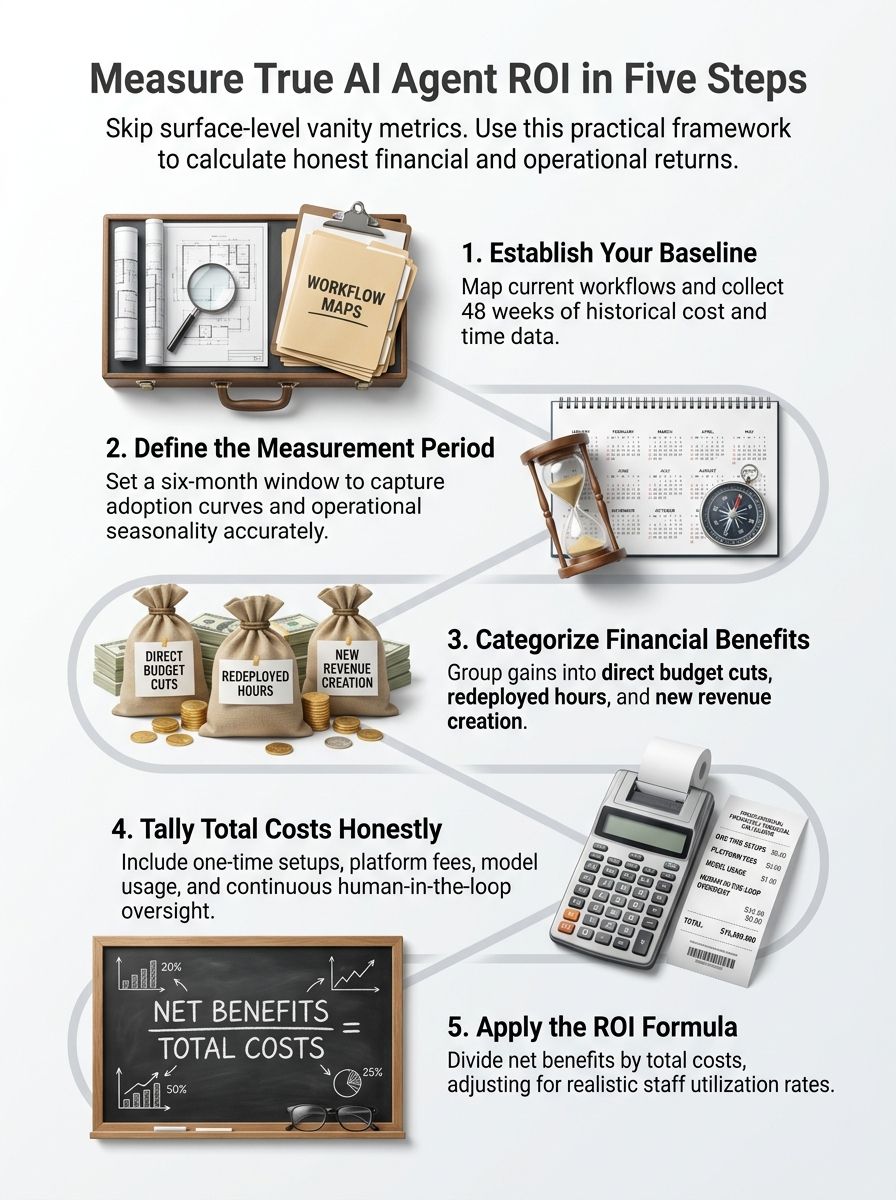
I use a five-step framework to measure AI agent ROI in a way that a finance lead, operations lead, and delivery team can all defend. The goal is simple: connect the agent to measurable outcomes before the rollout starts, then keep the math honest after deployment.
Step 1: Establish a baseline before deployment
I begin by mapping the current workflow. That means volume, handling time, error rate, rework, backlog, SLA performance, and customer satisfaction.
If seasonality matters, I want as much history as I can get. Six months is often workable, and a full year is better.
Baseline data is what stops teams from overestimating value later. Without it, even a modest improvement can look huge because there is nothing solid to compare against.
- Measure average handling time per unit.
- Track monthly workload volume and backlog.
- Capture error, rework, escalation, and reopen rates.
- Record CSAT, SLA attainment, and unit cost.
If the workflow touches regulated data or sensitive decisions, I also document the existing approval and review controls before I deploy the agent.
Step 2: Define the measurement period
After the baseline is set, I choose a measurement period that matches the adoption curve. Short windows create false confidence. A rollout can look great in the first few weeks, then weaken once integration friction, support demand, and edge cases show up.
I prefer a period long enough to capture early noise, workflow learning, and steady-state behavior. For many enterprise deployments, six months is a practical minimum.
Then I annualize benefits carefully. That gives business leaders a clearer view of the likely return on investment without pretending that week three performance is the new normal.
Step 3: Categorize benefits (cost reduction, revenue growth, risk mitigation)
This is where the business case becomes useful. I sort benefits into cost reduction, revenue growth, and risk mitigation.
Cost reduction includes fewer hires, lower overtime, reduced contractor spend, and lower cost per case. Revenue growth can include more throughput, faster lead response, improved conversion, or lower churn. Risk mitigation includes fewer errors, faster policy checks, and stronger control coverage.
NIST’s AI Risk Management Framework calls for ongoing monitoring and periodic review of AI risk management. I use that logic in ROI work because risk reduction only counts if the control is real, repeatable, and visible in operations.
This three-bucket model also makes stakeholder conversations easier. Finance cares about dollars, operations cares about throughput, and governance teams care about risk exposure. A clean benefits map speaks to all three.
Step 4: Tally total costs honestly
I add every one-time and recurring cost before I run the formula.
That includes discovery, process design, integration, testing, training, licenses, model usage, support, observability, compliance work, and human oversight. If the agent needs review queues, exception handling, or policy checks, those costs belong in the model too.
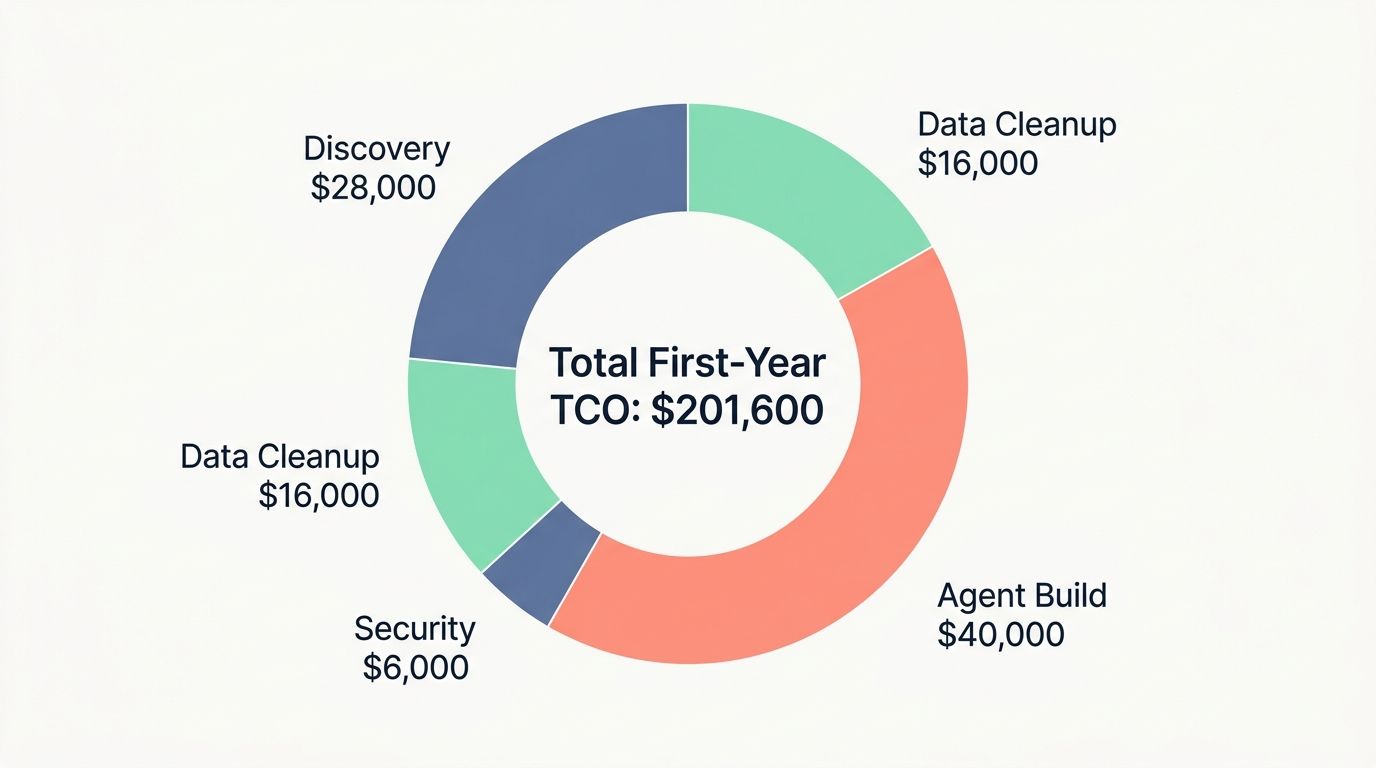
A compact claims automation model keeps this honest. In one first-year tally, the one-time costs were discovery and process mapping at $28,000, data cleanup and labeling at $16,000, agent build and testing at $40,000, and security and compliance reviews at $6,000.
Annual recurring costs were platform license at $42,000, model usage and API at $24,000, monitoring and observability at $9,600, and human-in-the-loop plus support at $36,000. That put total first-year TCO at $201,600.
Against an annualized benefit estimate of $260,000, ROI came out to 29%. Including these modest items turned a flashy headline ROI into a measured first-year return.
I also budget for drift. If prompts, data, policy rules, or upstream systems change, the workflow will need tuning, retesting, and sometimes retraining.
Step 5: Apply the ROI formula and contextualize results
Once I have benefits and costs, I run the formula: ROI = (Benefits – Costs) / Costs.
Then I add context. A single ROI percentage is useful, but it does not tell the full story.
I like to pair ROI with payback period, adoption ramp, and a conservative scenario. That shows how quickly the investment may return cash and how sensitive the result is to real-world adoption.
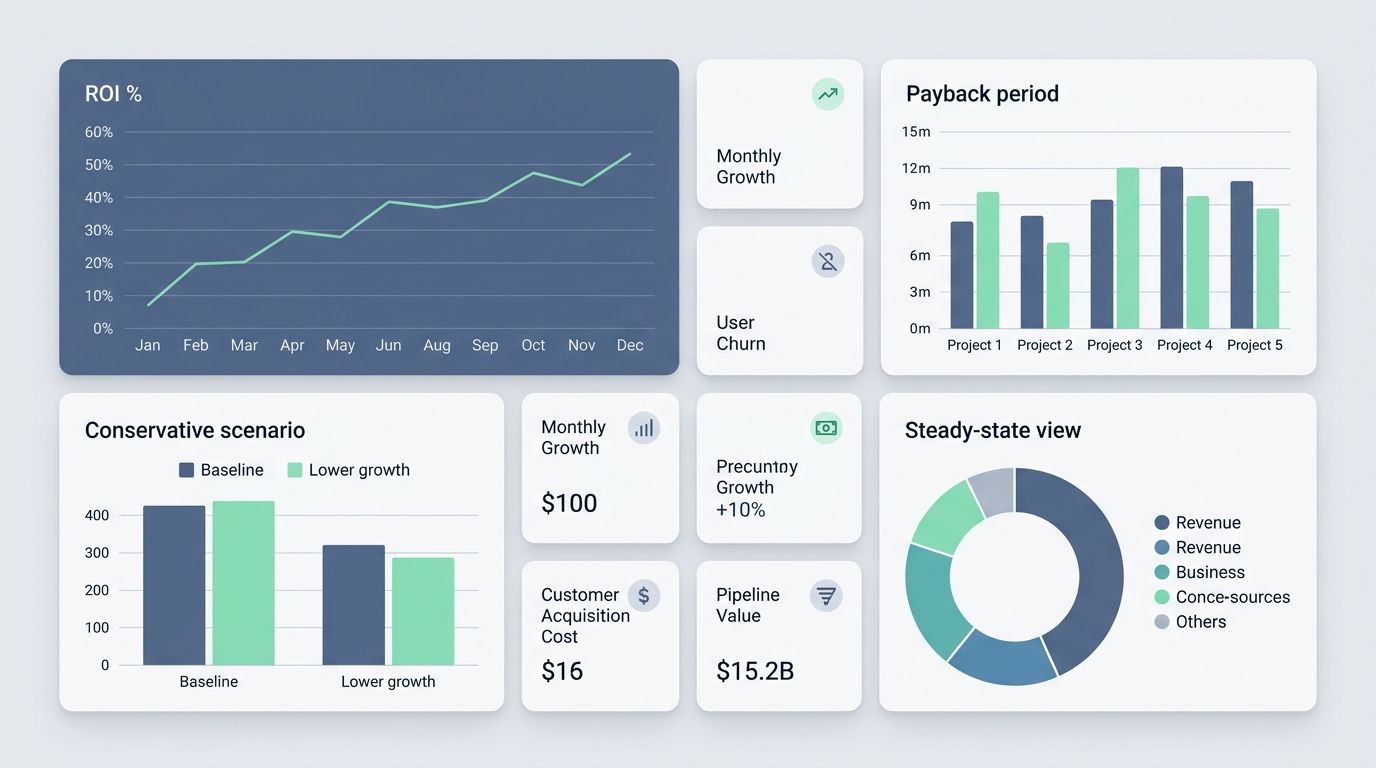
| View | Question answered |
| ROI % | Did benefits exceed costs? |
| Payback period | How long until the investment pays for itself? |
| Conservative scenario | What happens if adoption or utilization is weaker than planned? |
| Steady-state view | What could the workflow return once it matures? |
This step matters because a good ai agent roi story is never just one number. It is a number with assumptions that people can inspect.
Avoiding Common ROI Measurement Mistakes
Most AI ROI mistakes are not math errors. They are framing errors. Teams count the wrong benefits, skip the messy costs, or measure too early. If you fix those habits, your ROI model gets much harder to knock down.
Misinterpreting time saved
I never equate time saved with headcount savings unless staffing, workload, or budget actually changed.
That is the fastest way to create phantom gains. Time saved can still be valuable, but I report it as capacity value unless the organization truly removed spend.
In practice, I ask three questions:
- Did the saved time increase throughput?
- Did it reduce overtime, contractor use, or hiring pressure?
- Did staff move to higher-value work with a clear output?
If the answer is no, I keep the number out of hard savings.
Ignoring maintenance and drift costs
Maintenance is not a footnote. In many ai agents in production, it becomes a meaningful part of the cost curve.
Monitoring, retraining, regression testing, policy reviews, and support all recur over time. So do incident response and access reviews when the workflow touches sensitive systems.
OWASP’s 2025 guidance for LLM applications recommends human-in-the-loop controls for privileged operations. That is a security point, but it is also an ROI point because every review step has a labor cost.
When those controls are missing from the business case, the projected return looks stronger than the operating reality.
Using short-term measurement windows
Short windows hide the real pattern. Early wins can fade, and early friction can smooth out.
I have seen an automation pilot look amazing in the first month because only the easy cases flowed through it. By month four, exception handling and support load had changed the economics.
That is why I prefer a measurement window that includes ramp-up and steady usage. For many enterprise workflows, six months gives a much more credible view than four weeks.
If the workflow is seasonal, I extend the window or compare it against the same period from the prior year.
Proving AI Agent Value Beyond Hard Metrics
Hard metrics carry the business case, but they are not the whole story.
Some of the most important gains from enterprise ai show up as better responsiveness, stronger control coverage, or the ability to scale a workflow without rebuilding the team.
Measuring strategic advantages
I track strategic value separately so it does not get mixed into hard savings. That keeps the core ROI model clean while still giving leaders a fuller view of the investment.
Strategic gains can include faster launches, better policy consistency, improved knowledge reuse, and stronger readiness for larger agentic ai deployments later.
These gains are harder to quantify, so I describe them with evidence from the workflow itself. That might be shorter turnaround, fewer manual handoffs, or the ability to support more use cases with the same team.
The key is to keep the language concrete. I do not say the agent improved agility. I say it cut review queues, shortened turnaround, or made a process easier to scale.
Communicating ROI to stakeholders
When I present ROI, I keep the message simple: what changed, what it is worth, what it cost, and how confident I am in the result.
Different stakeholders care about different outcomes, so I tailor the view without changing the math.
- Finance leaders want ROI, payback, and cost assumptions.
- Operations leaders want throughput, backlog, SLA, and error trends.
- Governance leaders want risk controls, review coverage, and failure handling.
- Executive sponsors want the business case in plain language.
I also show the adoption curve. That prevents people from assuming that month one performance equals mature workflow performance.
If the result is mixed, I say that clearly. Honest reporting builds more trust than a polished number that falls apart under questioning.
Wrapping Up
Clear ai agent roi comes from disciplined measurement, not from excitement about the technology itself.
I look for a grounded baseline, honest total cost of ownership, realistic utilization, and a short list of metrics tied directly to business value. That is how I measure roi without vanity metrics.
If you do that well, you can calculate roi with ai agents in a way that stands up to finance, operations, and governance review, and that is what helps enterprise teams realize roi at scale.
Frequently Asked Questions on AI Agent ROI
1. What are vanity metrics, and why should I avoid them when measuring AI agent ROI?
Vanity metrics are numbers that look good, but do not show real value, like page views or raw clicks. They can hide true ROI, so focus on impact, not fluff.
2. How do I measure true ROI for an AI agent?
Track direct outcomes, like cost savings, conversion rate lift, and time saved per task, then compare to the agent cost. Count gains from fewer customer inquiries handled by humans, higher sales, and faster workflows, and do the math.
3. Which metrics actually matter for AI agent performance?
Use conversion rate, net cost savings, response time, error rate, and customer retention, these show value in simple terms.
4. How do I set up a test to prove AI agent ROI?
Run a controlled test, compare groups with and without the agent, and analyze customer data before and after. Keep human oversight, use marketing automation where it fits, and avoid chasing vanity numbers.