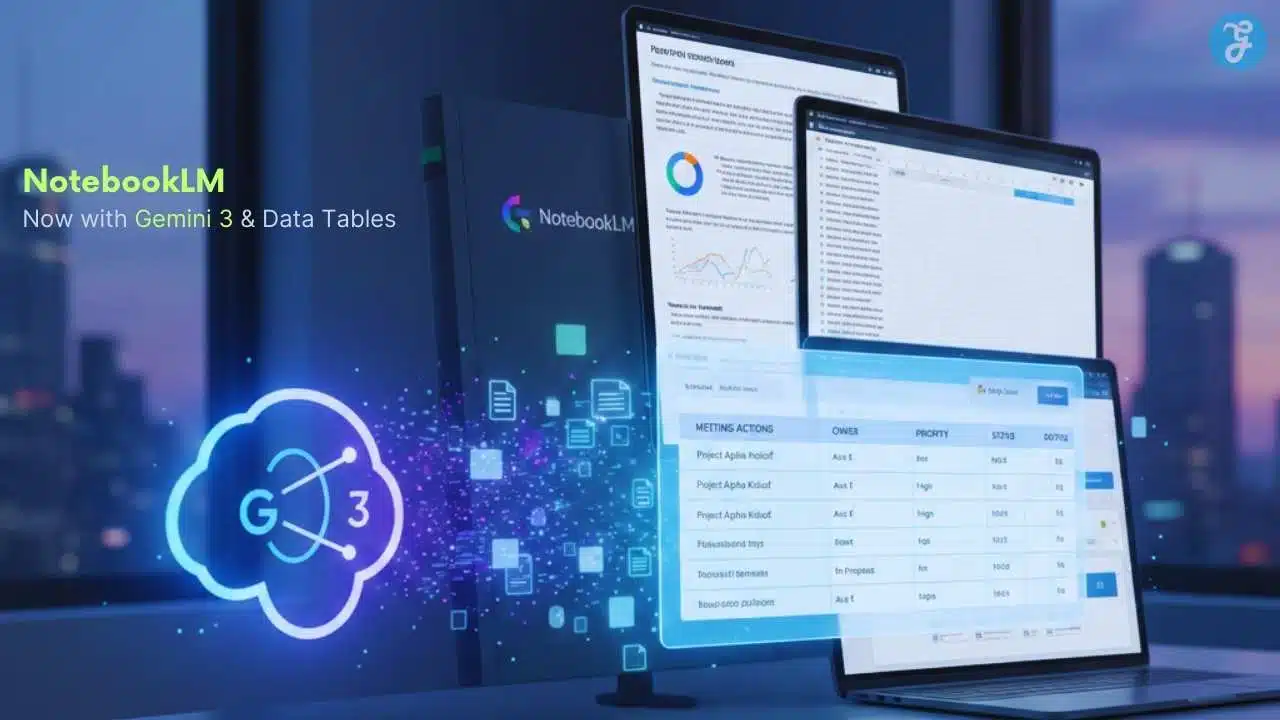
NotebookLM upgrades to Gemini 3 and adds “Data Tables,” a Studio feature that turns your sources into structured tables you can export to Google Sheets—aimed at speeding up research, planning, and reporting.
NotebookLM upgrades to Gemini 3: what happened and why it matters?
Google has updated NotebookLM—its AI research and writing assistant—so it now runs on Gemini 3, the company’s latest generation of AI models. The change is designed to improve how NotebookLM reads, connects, and explains information across the sources you upload or link inside a notebook.
NotebookLM’s role is different from a general chatbot. It is built around your materials—PDFs, documents, web pages, and other files—and it answers questions using those sources as the basis. That “source-grounded” approach is why the model upgrade is important: the better the underlying reasoning and comprehension, the more useful NotebookLM becomes for real research workflows, including education, business planning, and journalism.
At the same time, Google is expanding what NotebookLM can produce, not just what it can answer. The biggest addition in this update is a new output format in Studio: Data Tables, which is meant to convert messy, scattered details into structured, reusable data.
Snapshot: What’s new in this release?
| Area | What’s new? | What users can do with it? |
| AI model | NotebookLM upgraded to Gemini 3 | Expect stronger reasoning and better handling of complex source material |
| Studio output | New Data Tables option | Turn notes/sources into structured tables for comparisons, tracking, and review |
| Exports | Improved export flow | Move tables and reports into Google Sheets for editing and sharing |
Data Tables in NotebookLM: how it works and what you can use it for
The new Data Tables feature is part of NotebookLM’s Studio panel, where the product already generates multiple “end outputs” (such as study resources and presentation-style materials). With Data Tables, the goal is simple: take information that is normally buried in long notes, transcripts, research reports, or scattered sources—and organize it into a table with clear rows and columns.
How users generate a Data Table?
Inside any notebook, users can open Studio and choose Data Tables. The tool can generate a default table, but it also supports customization. Users can describe the structure they want—what each row represents, what columns should contain, and what level of detail is needed. This matters because tables can quickly become confusing if the AI doesn’t follow a consistent schema.
A practical approach is to define the table like this:
- Rows = items you’re comparing (companies, products, events, policies, research papers, etc.)
- Columns = attributes you need (price, launch date, claims, evidence, risks, references, next steps)
That structure turns Data Tables from a “neat formatting trick” into a real productivity tool.
Export to Google Sheets: why it’s a key part of the feature
Google is tying Data Tables directly to export workflows, particularly Export to Sheets:
- If a report contains multiple tables, exporting can place each table in its own tab in a Google Sheets file.
- If you export a Data Table, NotebookLM can place the table in one tab and add citations in a separate tab, which helps trace where each row’s information came from.
This export design is significant because spreadsheets are still where most teams do their final organizing: editing, filtering, sorting, adding columns, and collaborating.
Where Data Tables can save the most time?
Data Tables can reduce the manual work that often happens after research—copying facts into spreadsheets, building comparisons, and tracking open questions. Here are common scenarios where tables can be especially useful:
- Meeting or interview transcripts: convert long conversations into action items, owners, deadlines, and open questions.
- Product or competitor research: build feature-by-feature comparisons across multiple companies.
- Policy or legal research: compare requirements, exceptions, enforcement bodies, and timelines.
- Academic study: compile key details from multiple papers into a single grid (method, sample size, findings, limitations).
- Editorial planning: track story angles, sources, claims needing verification, and publication readiness.
Examples of table templates users can ask NotebookLM to generate
| Use case | Suggested rows | Suggested columns |
| Competitor comparison | Competitors | Product focus, key features, pricing model, target users, gaps |
| Research summary | Research papers | Research question, method, sample size, findings, limitations |
| Editorial tracker | Story ideas | Angle, evidence available, sources needed, risk/ethics checks, status |
| Meeting action log | Decisions/tasks | Task, owner, deadline, dependencies, follow-up notes |
What Gemini 3 brings to NotebookLM: better reasoning and multimodal understanding?
Google’s Gemini 3 is positioned as an upgrade in reasoning and multimodal capability—meaning it is built to understand and work across formats like text and images, and handle more complex, multi-step problems.
For NotebookLM, this matters because the product is often used for:
- long documents (reports, books, court filings, academic PDFs).
- multiple sources at once (cross-checking and synthesizing).
- structured outputs (reports, study materials, slide-style content, and now tables).
A model upgrade can make NotebookLM more accurate at:
- pulling the right details from long sources.
- keeping context consistent across multiple turns of conversation.
- making cleaner transformations (like turning narrative text into tables).
It also supports a broader trend NotebookLM is increasingly designed to take you from research → structured output → shareable artifact without leaving the tool. The Gemini 3 foundation is meant to make those transformations more dependable.
Availability: who gets Data Tables now, and what to know about plans?
Google’s rollout strategy for NotebookLM features has often followed a tiered pattern, where advanced outputs arrive first for paid plans and then expand to wider access.
For this update:
- Data Tables are available first to Pro and Ultra users, with broader availability expected to follow.
- NotebookLM continues to expand across platforms, including mobile access in supported regions, and deeper Workspace/enterprise positioning through dedicated offerings.
From a practical standpoint, the plan level can matter most for people who use NotebookLM heavily—because usage limits and notebook/source capacity can shape whether it becomes a daily workflow tool or an occasional assistant.
Why limits matter for real-world research?
| Research style | Typical need | Why plan limits may matter |
| Occasional use | 1–5 projects, small sources | Free/standard limits may be enough |
| Newsroom/editorial | Multiple ongoing beats | More notebooks and sources reduce fragmentation |
| Academic research | Large paper libraries | Higher source limits improve synthesis |
| Business strategy | Many docs + ongoing updates | Larger daily limits support continuous use |
This NotebookLM upgrade is not just about a newer AI model name. The shift to Gemini 3 is meant to strengthen the core job NotebookLM is hired for: understanding complex sources and turning them into usable outputs. Meanwhile, Data Tables pushes NotebookLM closer to being a true “research workspace” rather than a chat-only tool—because tables are how many people actually operate when they need comparisons, tracking, and shareable structure.
If Google continues building more structured Studio outputs that export cleanly into familiar tools like Sheets, NotebookLM could become a more central hub for research workflows—especially for students, analysts, and publishers who need to move from reading to organizing to producing, quickly and consistently