
Have you ever spent hours hunting a ghost bug in your code? You stare at the sources tab, set breakpoints, and still feel lost in the dom tree. You wish you could tame the chaos of the network tab or spot a bad http request at a glance.
Here is a fun fact: Chrome DevTools can highlight unused JavaScript during a page session, so you see red lines for code that never ran. In this post, you will grab 7 top tips, from smart breakpoints to console.log() tricks.
You will learn how to test network conditions, edit files in place, and monitor xhr requests. Read on.
Key Takeaways
- Use line-of-code and conditional breakpoints in the Sources tab to pause JavaScript and inspect variables. Chrome DevTools offers 7 breakpoint types for real-time debugging.
- Apply DOM breakpoints on elements to halt scripts when attributes change, nodes remove, or subtree updates occur. This helps you trace dynamic updates fast.
- Filter and throttle network calls in the Network panel by typing domains or file types and selecting presets like Fast 3G or Slow 3G. You can also block resources to test error handling.
- Leverage console methods—console.log(), console.table(), console.count(), and console.group()—to log messages, view arrays as tables, count loop runs, and group related output.
- Enable Local Overrides in the Sources pane to edit HTML, CSS, or JS live. Save changes in a local folder for instant page updates and streamlined front-end testing.
Use Line of Code Breakpoints

Line of code breakpoints inside Chrome DevTools let you pause JavaScript in the Sources tab. They let you inspect argument values and app logic without extra console.log() calls.
- Open Chrome DevTools, switch to the Sources tab, pick your .js file, and click a line.
- Spot a blue icon that marks your break marker inside the code.
- Hit Resume, Step Over, Step Into or Step Out to move through functions.
- Toggle Deactivate Breakpoints to skip them when you test other logic.
- Turn on Pause on Exceptions to catch errors without extra console.log() calls.
- Use this one of seven breakpoint types to speed javascript debugging and boost web performance.
- Watch variable values and call stacks in any chromium-based browser to spot issues in real time.
Leverage Conditional Breakpoints for Specific Scenarios
Conditional breakpoints save you from noise during javascript debugging. They pause code only when a condition returns true.
- Open chrome devtools and click the Sources tab.
- Right-click a line breakpoint and select Edit Breakpoint.
- Type a JavaScript expression that must be true.
- Spot an orange icon next to your source line, this marks the conditional break.
- Halt execution in loops to aid javascript debugging only on true hits.
- Cut noise in the web inspector by pausing code only at real issues.
- Combine these breaks with xhr breakpoints for deep tracing.
Utilize DOM Breakpoints to Monitor Element Changes
Chrome DevTools can pause scripts when elements change on the page. DOM breakpoints help you trace any div tweak or dynamic update fast.
- Open the Elements panel in chrome devtools to inspect the divs you want.
- Right-click that node and select Break on, then pick subtree modifications to stop on child changes.
- Pick attribute modifications to catch style or class tweaks without sifting through logs.
- Choose node removal to pause code that deletes elements in javascript debugging flows.
- Spot the paused call in the sources tab to see the exact line of code.
- Note that DOM breakpoints rank among seven breakpoint types in chromium-based browsers’ developer tools.
- Use $0 to refer to your selected element and $1 for the previous pick for quick checks.
- Copy the JavaScript library selector via right-click, then paste it in console.log() calls to test changes.
Analyze Network Requests with Filters
Analysts cut noise with filters.
Developers isolate errors within seconds.
- Type a domain, file type or URL in the network panel search bar to filter requests; chrome devtools shows only matching items from cdns or local servers.
- Right-click network panel headers to enable the Source column; it shows the script, redirect, or document that started each call for deeper javascript debugging.
- Add the Rank column to reveal how the browser chooses which resource to download first; you see when Office 365 loads css before images.
- Block calls for images, external stylesheets or json files to test error handling; you simulate missing resources without changing code.
- Inspect the Timing view to see the start time, sequence and duration for every http request; you spot slow json or websocket transfers fast.
Leverage the Console for Debugging and Testing
The web browser console speeds up debugging and testing tasks. It helps you spot errors like a hawk and check values on the fly.
- Log messages with console.log(“debugmessage”), console.info(), console.error(), console.warn() in Chrome DevTools console to separate info, errors, and warnings clearly.
- Display arrays as sortable tables using console.table(array, columns) to scan elements at a glance.
- Track loop runs with console.count(“label”) during javascript debugging so you see how many times a block fires.
- Group related entries with console.group(), console.groupCollapsed(), console.groupEnd() for tidy output.
- Style output with CSS in console.log(“%c Text”, “color: red; font-weight: bold”) for quick visual cues.
- Run quick DOM queries with $ for document.querySelector and $$ for document.querySelectorAll in your desktop browser.
- Recall the last result with $_ and choose elements with $0 through $4 for instant tweaks.
- Stringify and parse objects via JSON.stringify() and JSON.parse() to handle JSON data on the fly.
Enable Local Overrides for Quick Edits
You can tweak live pages without leaving the browser. Local Overrides in the Sources pane let you edit HTML code, CSS stylesheets, or JavaScript files on the fly.
- Open Chrome Developer Tools and select the Sources panel, then enable Overrides in Settings. You must pick a local folder and grant file system access to store your edits.
- Edit Reset.css or any stylesheet, script, or markup file directly in Sources. Changes reflect on www.codemag.com instantly for rapid prototyping and testing.
- Use the Changes menu in the Sources panel to review all local edits before you merge them into your codebase. This step helps avoid missing fixes and keeps your workflow smooth.
- Copy modified styles or scripts from your Overrides folder into your project files in Visual Studio Code or another code editor. This process streamlines your front end development workflow.
- Work offline or test logic tweaks in the browser without touching the live server, since local edits override network files. Don’t forget to disable caching in the Network tab for true-to-live results.
- Validate your updates with console.log() messages in the Console panel to catch errors fast. Use this quick feedback loop for efficient JavaScript debugging.
Simulate Network Conditions to Test Performance

Testing on real networks reveals hidden slowdowns. Chrome DevTools lets you mimic those links.
- Open Developer Tools, click the Network tab, tap the triple dot, then pick Connection Settings to control network conditions.
- Disable cache in this panel. This forces fresh data on each refresh.
- Select a preset like Fast 3G or Slow 3G to test page loads under typical mobile speeds.
- Change the user agent to mimic an Android phone or a desktop browser. This checks server reactions to different headers.
- Block specific requests such as large scripts or bulky images. This reveals fallback behavior when resources go missing.
- Apply throttling presets or use an external extension like Requestly. This helps gauge performance in varied real-world scenarios.
Inspect HTTP Requests and Responses Details
Inspect HTTP requests and responses in chrome devtools for quick fixes. The network tab shows headers, cookies, payloads, and response bodies.
- Activate the network tab to log every HTTP call. You see details like request name, status code, and size.
- Open the Timing tab to find stalled, queueing, DNS lookup, or TTFB delays. Use these metrics to optimize web applications.
- Right-click a request entry to export as fetch or curl. You can replay calls in Postman or a terminal.
- Enable the Preserve log option to save entries across reloads. It helps trace redirect loops or auth handshakes.
- Save a HAR file for offline review or sharable records. Team members can analyze session data without a browser.
- Filter requests by domain to catch calls to Google, Facebook, or Amazon. This helps flag hidden third-party scripts.
- Inspect payloads in JSON or XML to validate javascript object notation. It reveals serializing errors in API calls.
- Modify HTTP headers with a chrome extension or a web proxy like Requestly. You can test CORS, SSL, and auth flows.
- Disable caching to reload resources on each request. This prevents stale files from hiding console.log() output or other errors.
Find and Remove Unused JavaScript for Optimization
Chrome DevTools offers a Coverage panel that spots unused JavaScript in seconds. It works inside the Sources tab to show executed versus unused code.
- Open the Sources panel and click the Coverage icon to reveal the feature.
- Use the command palette with CTRL+SHIFT+P or CMD+SHIFT+P to launch the Coverage report.
- Hit the reload button inside the Coverage view to record script execution under real network conditions.
- Check the bar chart to compare total bytes against unused bytes for each file.
- Spot red lines on unused JavaScript and note the dead code segments in each script.
- Prune dead code from large web based applications to cut download size and improve page load time.
- Implement code-splitting and lazy-loading in your build to load only the scripts you need.
Debug Asynchronous Code with XHR Breakpoints
XHR breakpoints pause code when specific AJAX calls fire. You add them in the Sources panel under XHR/Fetch Breakpoints.
- Open the Sources tab in Chrome DevTools and expand the XHR/Fetch Breakpoints section to set a new breakpoint.
- Enter a URL filter, for instance *.google.com, to pause JavaScript execution on matching HTTP requests.
- Resume your code and let Chrome pause at the exact moment a call fires, helping debug single-threaded asynchronous flows.
- Inspect the call stack and request payload to catch unexpected API behavior or semi-structured data errors in JSON.
- Analyze response headers and status codes right in the Network panel to spot caching issues or incorrect data URIs.
- Switch to the Network > WS tab and set breakpoints on WebSocket frames to debug real-time messaging apps like WhatsApp.
- Note that DevTools has seven breakpoint types, and XHR breakpoints shine for API request traces in javascript debugging.
- Use console.log() before hitting a breakpoint to log variable states and tweak values on the fly in the developer tools console.
Test Responsiveness with Device Mode
Device Mode lets you mimic phones or tablets in Chrome DevTools. It helps you check responsive design and network conditions.
- Open emulation bar in Chrome DevTools to preview responsive design on phones.
- Select presets like Pixel 5 or iPhone 12 directly in the tool panel.
- Adjust custom width, height, and DPI to match target device parameters.
- Throttle network conditions to simulate 3G or 4G speeds and test load times.
- Toggle sensor panel for location, orientation, and touch events during mobile testing.
- Explore app panel to inspect local storage entries and indexed DB databases.
- Connect Android phone to PC via USB cable and debug pages on real hardware.
- Try Safari connection on Mac to test iPhone layouts in real time.
Monitor Memory Usage to Spot Leaks
You can track memory in your app. It helps you spot leaks fast.
- Open Performance dashboard in DevTools to enable memory profiling, click Record, interact with page, then click Stop to view data.
- Watch the blue graph line in the Performance dashboard, a constant rise in web browsers signals a memory leak.
- Inspect the Heap snapshot view to see allocated objects, blue regions mark memory that never freed.
- Note the gray areas in the Memory section, they show memory that returned to the system.
- Explore Allocation Tracker on Timeline to match memory spikes with code events for javascript debugging.
- Log object counts with console.log() at key stages to compare memory usage changes.
- Disable caching in network conditions to catch leaks in long-running single-page apps, find performance bottlenecks, and improve user experience.
Use the CSS Overview Panel for Style Insights
The CSS Overview panel shows a detailed style report. It works in Chrome DevTools.
- Command Menu opens the CSS Overview panel in chrome devtools with CMD+SHIFT+P or CTRL+SHIFT+P.
- Select Capture overview to run a five-section report covering overview, elements, external style sheets, contrast issues, colors, font info, and unused declarations.
- Scan report sections that list contrast issues and unused declarations to spot design gaps and redundant code.
- Highlight color palette details in the colors section to match web standards and catch jarring shades.
- Remove unused rules flagged under unused declarations to trim CSS, speed rendering, and cut down cached file size.
- View media queries panel to see all rules sorted by occurrence and test breakpoints for responsive layouts.
Replay and Edit Network Requests for Better Testing
You can debug network calls with chrome devtools in a new way. This method lets you replay and tweak each request to test your app fast.
- Right-click requests in the network tab of chrome devtools, part of your developer tools, to edit payloads, replay calls, or export as fetch or curl.
- Download HAR files to share session snapshots and dive deep into timing, headers, and status codes with your team.
- Route single HTTP calls through Requestly to throttle speed, delay responses, or rewrite headers in real time.
- Hand off logs with SessionBook so other developers can replay your exact network session.
- Replay websockets and jQuery Ajax flows to track complex client-server exchanges and bust hard bugs.
- Simulate different network conditions without changing code to test performance on slow links or spot timeouts.
- Drive API and backend tests by importing HAR or curl exports into Postman, npm scripts, or other tools.
Explore the Command Menu for Quick Actions
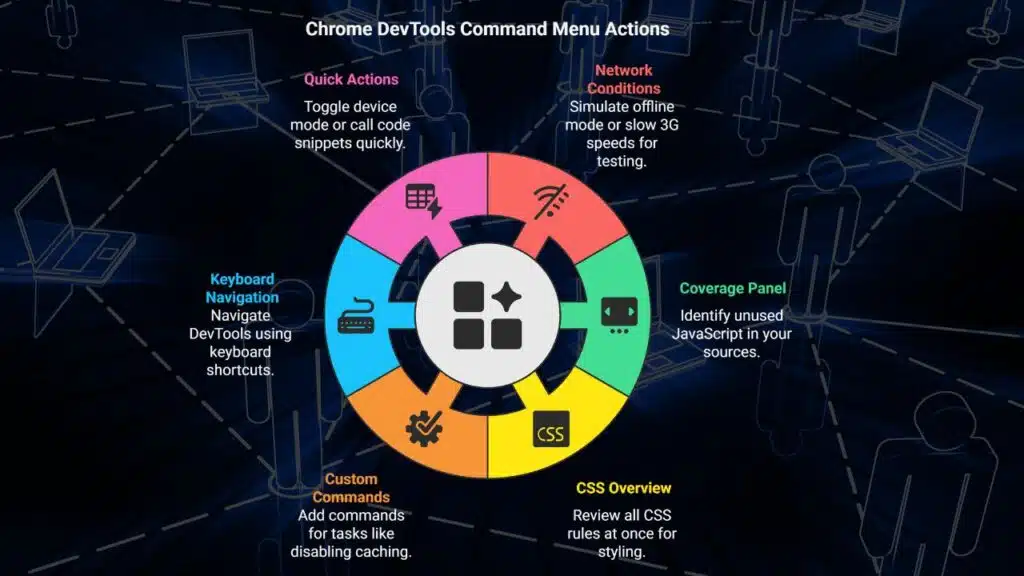
The Command Menu in Chrome DevTools snaps open with a simple shortcut. It cuts mouse clicks and speeds up workflows.
- Press CMD+SHIFT+P or CTRL+SHIFT+P to open the command menu and pick any panel in developer tools.
- Type “network conditions” to filter the network tab and simulate offline mode or slow 3G speeds.
- Enter “coverage” to launch the coverage panel and spot unused JavaScript in your sources tab.
- Try “css overview” to fire up the style overview panel and review all CSS rules at once.
- Add custom commands for tasks like disable caching, console.log() injections, or test img src swaps.
- Swap the mouse for keys and cut clicks in half to navigate to the rendering engine, run tests, or open the console tab with ease.
- Treat quick actions like an excel filter to find features, toggle device mode, or call a code snippet to make a webpage in seconds.
- Enjoy a user-friendly, keyboard-driven workflow that fits modern web technologies and speeds up JavaScript debugging.
Record and Replay User Flows for Comprehensive Debugging
You can record every click and drag to replay real user flows. This technique helps you catch hidden slow spots.
- Open the chrome devtools Performance panel and hit record, then click and drag through your page. Stop to save your flow.
- Replay the session in developer tools to watch each step, and spot stalls in the CPU, network, rendering, and scripting tracks.
- Use the network tab filters to mimic slow 3G, apply network conditions, and compare load times.
- Check timeline and event logs for every click, trace script calls for javascript debugging, and use console.log() markers to flag actions.
- Spot bottlenecks in single-page apps with the sources tab, catch broken promises and laggy functions.
- Enable disable caching, reload the page, and record again to test fresh asset load performance.
- Run end-to-end tests inside the browser, replay multiple flows, and gather metrics on load times and responsiveness.
- Review Performance panel charts, examine memory streams to spot leaks and analyze user flow delays.
- Set XHR breakpoints before you record, target key API calls, then replay to see data pauses.
Takeaways
These seven Chrome DevTools tricks will jazz up your debug work, speed up fixes, and tame sly bugs. The Sources tab leaps you to code breaks, the Console logs real-time chatter, and the Network tab trims slow calls.
XHR breakpoints guard async tasks, DOM watches catch element shifts, and the CSS Overview panel spots style waste. Apply these tips daily to catch issues before they run wild across your site.
FAQs
1. What can I do with the sources tab in chrome devtools for javascript debugging?
The sources tab is like a map of your code. You can open files, set breakpoints, step through each line, and watch how variables change in real time.
2. How do I use xhr breakpoints in chrome devtools?
Go to the sources tab, find the XHR breakpoints section, click the plus sign, and type part of the request URL. Chrome will pause right before the ajax call so you can inspect the data like a detective on the case.
3. How can I test slow connections with network conditions and disable caching?
Open the network tab, click the throttling menu, and pick a slow preset or add custom speeds. Then check the disable caching box. Now your site runs like it is on a snail link and you can catch bugs that only show up on slow nets.
4. Why use console.log() and other developer tools in web development?
Console.log() is like a flashlight in the dark, it shows you the value of a variable right in the console panel. Chrome devtools also let you watch network calls and debug code step by step so you can beat bugs faster.