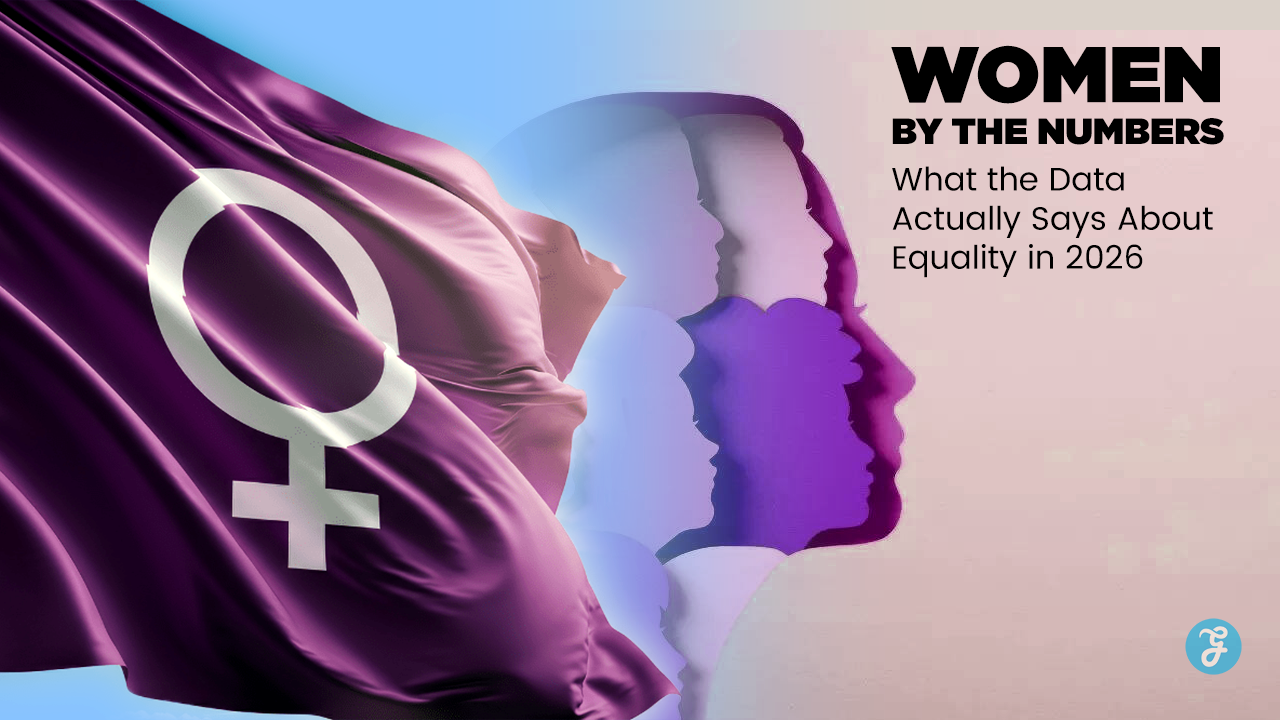
Every March 8, the world floods social media with purple banners, inspirational quotes, and carefully curated corporate tributes. But beneath the celebration, the question that matters most rarely gets asked: what do the numbers actually say?
The theme for International Women’s Day 2026, as declared by the United Nations, is “Rights. Justice. Action. For ALL Women and Girls.” The campaign theme chosen by the IWD global movement is “Give To Gain” — a call to recognize that investing in women is not charity, but economic strategy. Both themes converge on a single, urgent insight: words without data are just decoration.
This article takes a rigorous, data-first approach to answering the question every Women’s Day special should ask: how far has the world actually come, and how much further does it need to go?
At a Glance: Key Gender Data Points, 2025–2026
| Indicator | Figure | Source |
| Global gender gap closed | 68.5% | WEF 2024 |
| Years to full parity (current rate) | 134 years | WEF 2024 |
| Women in parliament (global) | 27.5% | IPU, Jan 2026 |
| Women in parliament (1995) | 11.3% | IPU |
| Women in cabinet (global) | 22.9% | UN Women 2025 |
| Female workforce participation | 41.2% | WEF 2025 |
| Women’s pay per male dollar (employed) | $0.78 | ILO 2025 |
| Women’s total labour income ratio | $0.52 | ILO 2025 |
| Women in senior management | 28.1% | WEF 2025 |
| Educational gender gap closed | 95.2% | WEF 2024 |
| Women heads of parliament (Speakers) | 19.9% | IPU 2026 |
| Americas: women in parliament | 35.6% | IPU 2026 |
| MENA: women in parliament | 16.2% | IPU 2026 |
The Big Picture: Closing the Global Gender Gap
The World Economic Forum’s Global Gender Gap Index is the most comprehensive annual measure of gender parity worldwide. In its 2024 report — the most recent complete dataset — the global gender gap stood at 68.5% closed. That may sound encouraging. But consider the inverse:
But consider the inverse: 31.5% of the gender gap remains open, and at the current pace of progress, the WEF projects it will take 134 years to achieve full global gender parity.
| 134 | Years to Full Gender Parity
At the current rate of progress — WEF Global Gender Gap Report 2024 |
| 68.5% | Global Gender Gap Closed
World Economic Forum, Global Gender Gap Index 2024 |
The regional disparity is stark. Northern Europe leads — Iceland has held the top spot for 15 consecutive years, with over 90% of its gender gap closed. Finland, Norway, Sweden, and New Zealand follow closely. Meanwhile, in the Middle East and North Africa, economic and political opportunities for women remain severely constrained, with several countries yet to close even 40% of their gap.
The four dimensions the WEF measures are Economic Participation and Opportunity, Educational Attainment, Health and Survival, and Political Empowerment. Of these, Educational Attainment is the most advanced globally — 95.2% closed. Health and Survival stands at 96% closed. The two areas where equality remains most elusive are the ones that directly shape power and prosperity: economic opportunity and political representation.
The Pay Gap: Women Earn 78 Cents to Every Dollar
Perhaps no statistic captures gender inequality more viscerally than the wage gap. According to the International Labour Organization (ILO), employed women worldwide earn approximately 78 cents for every dollar earned by male workers. This is the adjusted figure for employed workers. The full picture is significantly darker.
When total labour income is calculated — accounting for fewer women in employment overall, shorter hours, and lower wages — the ILO’s 2025 findings reveal that women collectively earn just 52 cents for every dollar earned by men. In 2004, that figure was 47 cents. Two decades of effort bought five cents.
| 52¢ | Women’s Collective Labour Income
Per dollar earned by men globally — ILO, 2025 |
| 78¢ | Individual Wage Gap
Female workers earn per male dollar (employed workers) — ILO, 2025 |
The regional variations are dramatic. In the Arab States, the ratio of women’s to men’s total labour income is just 14 cents — the lowest in the world. Africa follows at 35 cents. In contrast, Europe, Central Asia, and parts of the Americas have made more substantial gains, but no region has achieved parity.
The causes are well-documented: occupational segregation, the “motherhood penalty” that reduces women’s wages after having children, underrepresentation in senior roles, and persistent discrimination. The WEF notes that women are 55.2% more likely than men to take career breaks, and when they do, those breaks last an average of 19.6 months compared to 13.9 months for men — mostly due to caregiving responsibilities.
One figure underlines the structural argument: only 29.5% of tertiary-educated senior managers worldwide are women — even as women now outperform men in tertiary education enrollment globally. Education has not translated to equal economic power.
Women in the Workforce: Participation and the Participation Gap
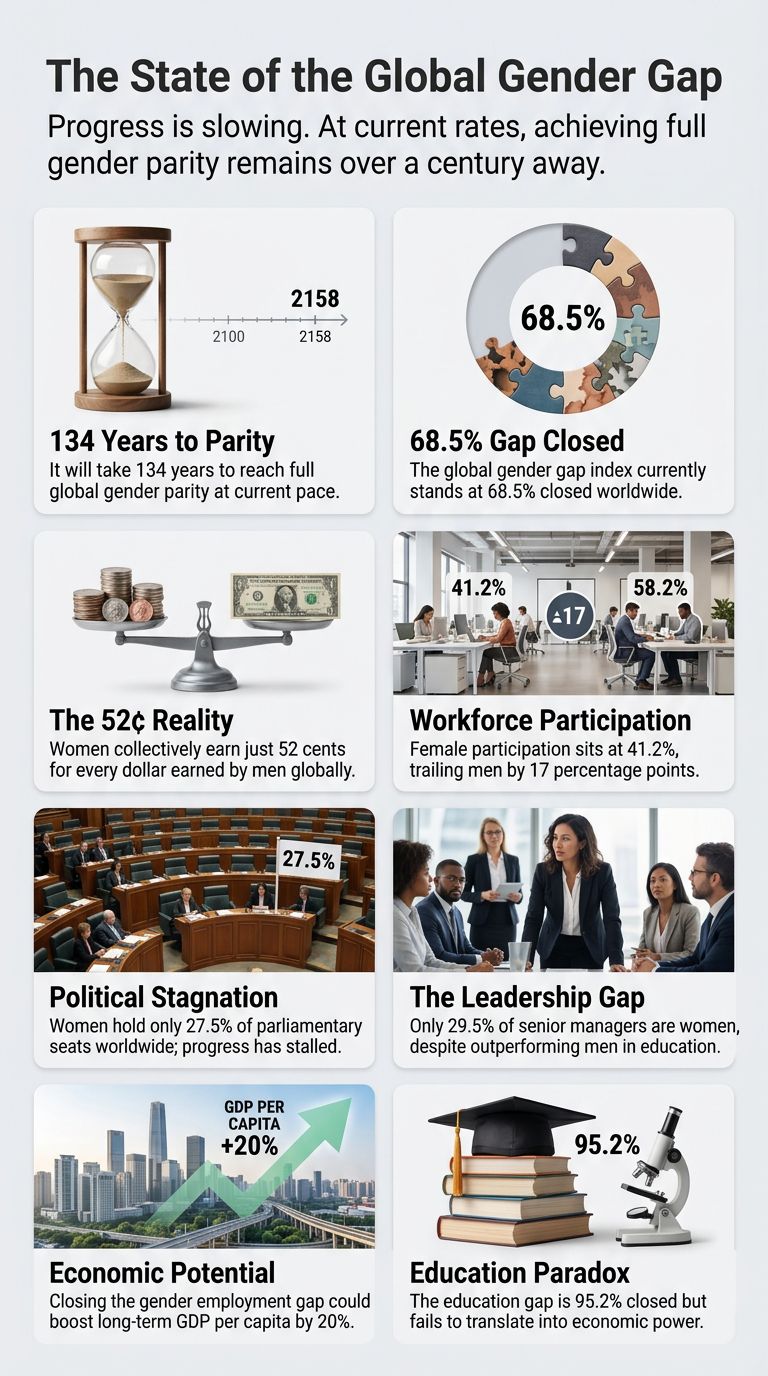
According to the WEF’s Global Gender Gap Report 2025, women’s workforce participation globally has reached 41.2%. This represents genuine progress — but it is still 17 percentage points behind men’s participation rate, and the gap has barely shifted in decades.
The ILO’s 2025 data shows 1.4 billion employed women compared to 2.1 billion employed men — roughly a 3:2 ratio. The economic cost of this imbalance is enormous. ILO estimates suggest that closing the gender employment gap entirely could deliver a 20% average gain in long-term GDP per capita across countries.
| 41.2% | Women’s Workforce Participation
Globally in 2025 — WEF Global Gender Gap Report |
| +20% | Potential GDP Gain
If gender employment gap were fully closed — ILO 2025 |
The sector-level picture is complex. Women dominate healthcare (64.7% of the workforce) and education, but remain severely underrepresented in infrastructure, finance, defence, and technology. In AI and STEM fields — the sectors set to define the global economy of the next century — women’s share of roles remains critically low.
Progress in senior leadership has been glacial. Between 2015 and 2024, the share of women in top management rose from 25.7% to 28.1% globally. That is a 2.4 percentage point gain in a decade — less than one quarter of a percentage point per year.
Politics and Power: 27.5% and Slowing
If economic equality is the arena where women are fighting hardest, political representation is the arena where the system is fighting back. The Inter-Parliamentary Union’s landmark 2026 report, released ahead of International Women’s Day, reveals a troubling stagnation.
As of January 1, 2026, women hold 27.5% of national parliamentary seats worldwide — up by just 0.3 percentage points from 2025. This marks the slowest rate of parliamentary progress since 2017, for the second consecutive year.
| 27.5% | Women in Parliament (Global)
As of January 1, 2026 — Inter-Parliamentary Union |
| 11.3% | Women’s Parliamentary Share (1995)
Progress over 30 years — IPU Women in Parliament 1995–2025 |
The thirty-year view offers mixed signals. Women held just 11.3% of parliamentary seats in 1995. The near-tripling of that figure represents real movement. But progress has stalled sharply. And the numbers at the very top of the governance ladder remain dismal: women account for just 22.9% of cabinet ministers globally.
Only six parliaments in the world have achieved gender parity or a majority of women: Rwanda leads at 63.8%, followed by Cuba, Nicaragua, Mexico, Andorra, and the UAE. Seven countries — Bolivia recently joined — have reached parity in at least one chamber.
Leadership roles within parliament are regressing. The proportion of women serving as Speakers of Parliament dropped to 19.9% in 2026, down from 23.7% a year ago. Of the 75 new Speakers appointed in 2025, only 12 were women.
The Americas remains the highest-performing region at 35.6% women in parliament, while the Middle East and North Africa lags furthest behind at 16.2%. The IPU warns that at the current rate, global parliamentary gender parity will not be achieved until 2063.
Education: Where Women Have Won — and Where It Has Not Been Enough
Education is the one arena where gender data delivers an unambiguous success story — and then immediately complicates it.
Globally, the educational gender gap is 95.2% closed. In many high- and middle-income countries, women now surpass men in university enrollment and graduation rates. Bangladesh is a case in point: the country has achieved near-parity in primary and secondary education enrollment, a transformation that stands among the most dramatic educational stories in South Asia over the past three decades.
And yet, education has not converted into economic or political power at the expected rate. Women represent 52% of global tertiary graduates but just 29.5% of senior managers. The WEF identifies this as a “critical systemic inefficiency” — a profound mismatch between skill preparedness and economic engagement.
In lower-income countries, the picture is more difficult still. UNESCO data highlights that girls in fragile states face compounding barriers: early marriage, conflict-driven school closures, lack of sanitation infrastructure, and gender-based violence. Progress in education, though real, remains fragile.
South Asia and Bangladesh: A Region of Paradoxes
South Asia presents one of the most intellectually complex gender data landscapes in the world. It is simultaneously a region of remarkable firsts — women heads of government in India, Pakistan, Bangladesh, Sri Lanka, and Nepal have appeared across recent decades — and persistent, structural inequality.
Bangladesh is instructive. The country achieved extraordinary progress in reducing gender gaps in education and, to a lesser extent, economic participation, driven largely by the garment industry’s role in bringing women into formal employment. According to the WEF, Central and Southern Asia holds 17% women in parliament — among the lowest regional figures globally — yet Bangladesh has historically performed above its regional average on several gender metrics.
The country’s recent political transition following the 2026 general election, which brought the BNP to power, raises important questions about the trajectory of women’s political representation in the post-Hasina era. Sheikh Hasina’s tenure produced contradictions: a woman leading the government while women’s parliamentary representation remained limited by structural and party-level barriers.
Bangladesh’s garment sector — which employs over 4 million workers, approximately 80% of whom are women — remains the backbone of women’s formal employment. Yet wages remain low, workplace safety inconsistent, and the path from factory floor to management remains narrow.
The country’s microfinance ecosystem, pioneered by institutions like Grameen Bank, has created millions of female entrepreneurs at the grassroots level — a genuinely transformative achievement. But access to capital at scale, to technology, and to formal managerial roles remains unequal.
Violence, Justice, and the Hidden Data
Any honest accounting of gender equality must confront the data on violence — data that is both incomplete and alarming.
The UN’s IWD 2026 theme, “Rights. Justice. Action. For ALL Women and Girls,” was specifically framed to address what the UN Women Executive Director described as the dismantling of barriers including discriminatory laws, weak legal protections, and harmful social norms. The framing is not accidental. It reflects a recognition that legislative progress has outpaced enforcement reality in many countries.
The IPU’s own 2026 research found that 76% of women parliamentarians in the Asia-Pacific region reported experiencing psychological violence in their roles. The same report found that women MPs globally are more likely than their male counterparts to experience intimidation and harassment — online and offline — with 76% of women surveyed reporting such violence versus 68% of men.
This political violence creates what researchers describe as a “chilling effect” — discouraging women from running for office and suppressing political representation at the source. Numbers in a parliament count only if women feel safe enough to stand for election in the first place.
The Economic Case: Numbers That Should End All Debate
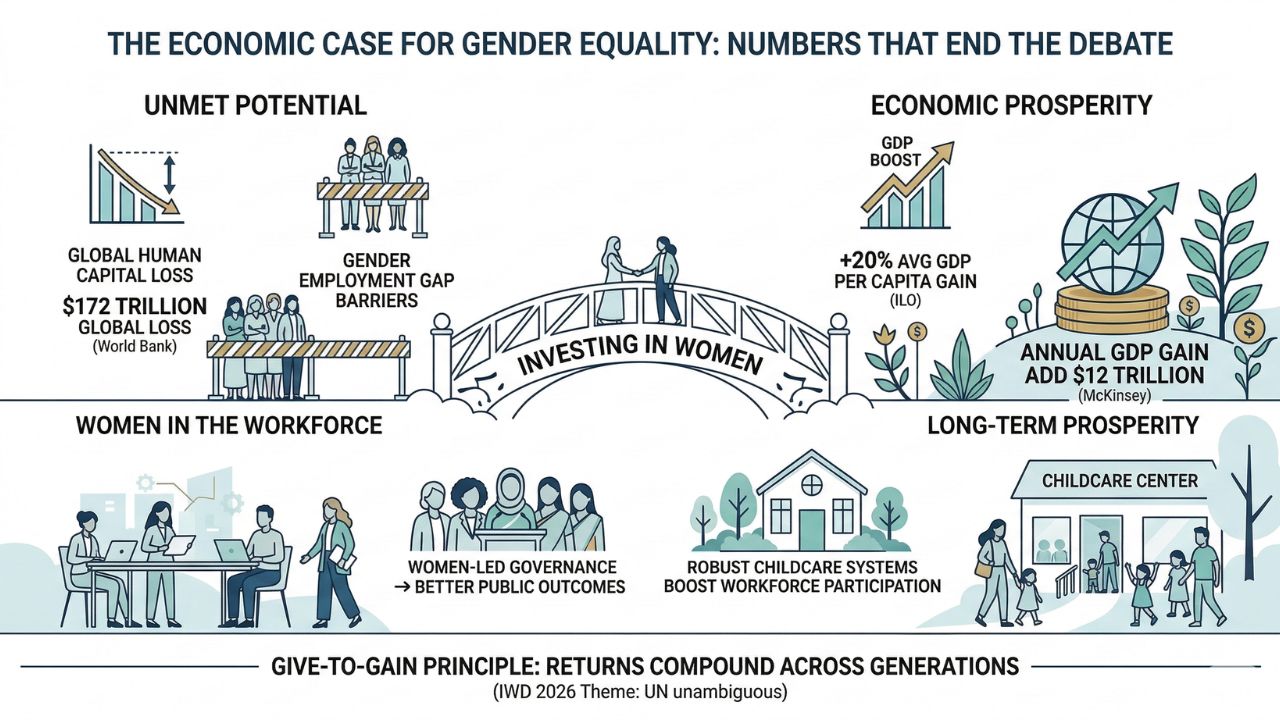
Gender equality is not just a moral argument. It is an economic one — and the numbers are unambiguous.
- Closing the gender employment gap could add an average of 20% to GDP per capita in most countries, according to the ILO.
- The World Bank estimates that the human capital loss from gender inequality across labour income amounts to $172 trillion globally.
- McKinsey Global Institute research has shown that advancing women’s equality could add $12 trillion to global GDP annually.
- Research in India found that districts with women-led local councils had 62% more drinking water projects — evidence that gender-inclusive governance produces better public outcomes.
- The ILO’s care economy research consistently shows that robust childcare systems boost women’s workforce participation — and therefore national economic output — while simultaneously improving child development outcomes.
The give-to-gain principle that underpins IWD 2026’s campaign theme is, in essence, a statement of economic logic: societies that invest in women’s rights, education, and economic participation get returns that compound across generations.
Final Thoughts
The data does not tell a story of failure. It tells a story of incomplete success — one where extraordinary progress in some areas (education, health, formal political inclusion) coexists with stubborn stagnation in others (wages, workforce leadership, parliamentary representation, and physical safety).
The numbers also carry a warning about pace. A 134-year timeline to parity is not the trajectory of a world that has genuinely prioritized gender equality. It is the trajectory of a world that has decided gender equality is acceptable as aspiration but uncomfortable as urgency.
The UN Women Executive Director’s statement for IWD 2026 declared: “Nothing can and nothing will stop us until the equal rights of all women and girls are realized.” Whether that proves true is not a matter of rhetoric. It is a matter of data — and whether, year by year, the numbers actually change.