
Many new traders jump into day trading and feel the heat fast. They watch charting tools show odd lines and wonder which way to go. They worry about price fluctuations and miss key signals.
Day trading means you buy and sell financial instruments in one day to gain from small price changes.
This post will show ten painless strategies that really work. You will learn risk management with stop loss orders, trend following, momentum trading, breakout trading using support and resistance levels, and more.
Ready to trade with less stress? Read on.
Key Takeaways
- Traders make a clear plan with goals, stop-loss rules, RSI, and MACD. They test it with 50 to 100 paper trades on TradingView or MetaTrader 4.
- Traders set stop-loss orders at 0.5% per trade, risk $200 on a $40,000 account, cap daily losses at $500, and keep $25,000 for FINRA day-trade rules.
- Traders follow trends with moving averages, buy breakouts past price barriers, watch volume spikes, and skip the first and last two minutes of trading.
- Traders trade one market per session with small lots or fractional shares. They log each move, review their journal weekly, and use Fibonacci lines. In March 2024, Sarah caught a 4% TSLA dip and made 6% on 200 shares.
Start With a Clear Trading Plan
![]()
A trading plan sets goals, risk tolerance, stop-loss orders, and entry and exit rules. The plan uses technical analysis tools like the relative strength index and moving average convergence divergence.
Simulator trading on TradingView or MetaTrader 4 tests that plan with fake funds. Logging each test trade shows when emotions push you to change stop-loss orders. This habit builds discipline and shrinks losses.
Focus on a Single Market or Asset
Focus on one market at a time. Clarity beats chaos, cuts stress. Most beginners pick one or two stocks per session. Charting platforms show price moves, help spot trends. Relative strength index and moving averages guide entries.
Higher trading volume and strong liquidity yield smoother trades.
Fractional shares let you buy Amazon stock for about five dollars. That lowers the entry bar, fuels confidence. Steer clear of penny stocks under five dollars, they trade over the counter and face delisting.
Use stop-loss orders and limit orders to guard capital and manage risk. Trend-following and momentum trading work best on a familiar asset.
Use the Trend-Following Strategy
Traders buy assets that climb and sell shares that drop, betting trends will carry on. They track trend lines and simple moving averages on a candlestick chart. They skip small pullbacks and trade in trend direction.
They set stop-loss orders at trend breaks. They exit when a reversal pattern forms or at the end of the day.
Chart watchers scan news wires for breakouts, trend exhaustion alerts, and artificial demand or supply. They add MACD or RSI to confirm strength. They avoid the first or last few minutes on the tape, since real money flows show up afterward.
They watch trading volume to back up each move.
Practice Risk Management With Stop-Loss Orders
Smart day traders set stop-loss orders just below a recent low for long plays or just above a recent high for short sells. This move limits a single swing to about one percent of an account balance.
A $40,000 account risks $200 at a 0.5 percent tolerance. Some stocks jiggle five cents per minute; those need a fifteen cent cushion over entry. Volatility drives cushion size. Simple choices tame trading volume bursts.
Some wrap a mental stop-loss around each trade. Some use the relative strength index or the moving average convergence divergence indicator to catch a move before a stop kicks in. They shift to real stop orders when limit orders lock the price.
Trailing stops ride momentum; they climb with a rising stock, they never back down. Set a daily loss cap and power down after that. Good risk management feeds calm nerves, tames trading psychology.
Avoid Overtrading and Stick to Your Plan
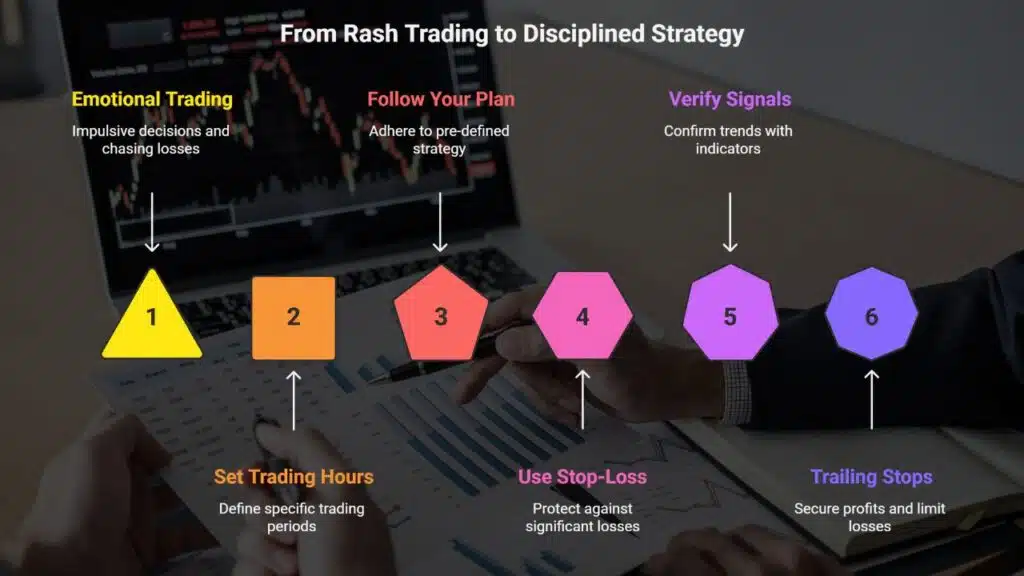
Day trading demands strict discipline. Trading outside set hours often leads to rash moves. Traders who chase losses can inflate trading volume and drain funds. Sticking to your plan acts like a shield; stop-loss orders serve as guard rails.
A 50 to 60 percent win rate works when gains on winners outpace losses. Investors can use a MACD indicator and RSI reading to verify trend following signals. Brief setups on moving average crossovers cut down on margin trading mistakes.
Using trailing stops, in electronic communication networks, cements emotional control.
Experiment With Paper Trading Before Committing Real Funds
Open a paper trading account on a simulator and record each trade. Run at least fifty to one hundred demo trades to test trading strategies and note entries, stop-loss hits, and profit targets.
Use technical analysis tools like the relative strength index and moving average convergence divergence to spot momentum trading signals. Track trading volume and bid-ask spreads as you backtest strategies for volatile or bearish stock market moves.
Consult free trading guides or books to refine your methodology without risking real money.
Switch to a live account only if your demonstration shows profit after fifty to one hundred trades. Watch your emotional control and follow strict risk management with stop-loss orders and trailing stops.
Apply a breakout trading setup or a fibonacci retracement tool to read market trends. Adjust your margin account size to match capital gains goals and avoid margin trading risks. Let this hands-on test guide your real investments.
Limit Emotional Decisions by Setting Profit Targets
Traders set profit targets before placing a trade. They scan RSI and MACD to find good exit points. A 5-cent stop-loss order calls for a goal over 5 cents. This plan uses trailing stops and fixed targets to curb emotional decisions.
Scalpers sell as soon as they hit a profit. Faders short after a quick rise and exit when buyers show up. Pivot traders buy at daily lows then sell on reversals. Momentum traders watch trading volume and exit when it drops.
Use the Breakout Trading Strategy for Strong Market Moves
A breakout strategy buys once the price clears resistance in an ascending triangle. A trader uses chart patterns as signals for technical analysis. Pattern height can set a profit goal.
Entry points depend on live news feeds, electronic communication networks, or intraday candlestick charts. Spikes in trading volume confirm momentum trading.
Strict risk management follows each entry. You place stop-loss orders below the old resistance or trend line. You measure the triangle height, add it to the breakout level, then pick a profit target.
Level 2 quotes from ECNs can improve fill prices. This method pairs trend following with moving averages or MACD.
Keep Positions Small to Minimize Losses
Open your account with a small lump sum and only risk funds you can afford to lose. Trade CFDs or shares with tiny lot sizes. Use stop loss orders to cap losses. Small stakes calm nerves and curb fear.
They also trim margin requirements and keep trading psychology in check.
Keep more than twenty five thousand dollars in your account if regulations allow. You gain a cushion against volatile swings on stock exchanges or cryptos. You test RSI or MACD on small bets to refine technical analysis.
You gather data on bid ask spreads, trading volume, pivot points trading and trailing stops. You master risk management and build confidence.
Take Advantage of Support and Resistance Levels
Traders spot support pivots on a chart to plan buys near lows. They combine those pivot levels with supply and demand zones and watch trading volume spikes for validation. Adding a moving average or Fibonacci retracement line boosts the setup.
Technical analysis uses the relative strength index or MACD to spot overbought or oversold zones. A tight stop-loss order below a support level keeps risk in check.
You can short near resistance pivots in a downtrend, or go long at strong support. Using a pivot calculator gives clear entry and exit references. A low RSI reading under 30 often signals a bounce off support.
Attach a trailing stop to lock gains past a pivot. This approach suits both day trading and swing trading.
Practice Scalping for Quick Profits
Scalping uses quick trades to grab tiny price gaps. Bots can fire orders in seconds, chasing low risk gains. High-frequency scalpers place hundreds of orders a day at big volume. Slower scalpers hold plays for minutes and work with fewer contracts.
Scalpers often use moving averages, the MACD, and the Relative Strength Index across timeframes. Scalpers rely on momentum trading to ride tiny movements. They track bid-ask spreads and watch trading volume before each entry.
They set tight stop-loss orders to cut losses fast.
This strategy demands intense focus and split-second calls. Strong trading psychology keeps you calm under stress. Many use automated bots on electronic communication networks to stay fast.
Margin trading can boost gains but raises risk.
Use the Pullback Trading Strategy for Better Entry Points
Pullback traders use technical analysis to buy dips during an uptrend, expecting the rally to resume. Confirmation needs two lower closes or two higher highs on price charts. Support areas like the 50-day moving average, pivot points, and Fib retracement lines offer clear entry zones.
Traders watch the RSI or MACD for momentum bias and place stop-loss orders below the swing low. Small position sizes limit risk and allow for smooth exits. High trading volume during the bounce added conviction.
Discipline and quick action pay off, no goat rodeos here.
In March 2024, Sarah caught a pullback in TSLA shares. Price dipped 4 percent to the 20-day moving average, then it rebounded over two days. She set a stop-loss near the swing low.
The trade tied a 6 percent gain and a $1,200 profit on 200 shares. Matching a pivot point with a 61.8 percent Fib level guided her buy. Traders who journal each move can sharpen entries fast.
Stay Informed With News Trading for Market-Relevant Events
News trading drives many day trading tactics. Traders scan a calendar and feed for key updates. They read statement releases and watch price impact on charts. They pair breakout trading with stop-loss orders under 1% to guard funds.
Traders act fast on market-moving news and spot volatility. Volume spikes hit after Fed rate decisions and earnings. A quick stop-loss at 0.5% protects gains. Sharp focus and rapid hands drive this day trading style.
Leverage Momentum Trading for High-Volume Stocks
High-volume stocks often show sharp jumps. Momentum trading means chasing those moves, riding price surges. They watch the moving average convergence divergence (MACD) indicator for early signals.
A rising relative strength index above 70 can confirm strength. A stochastic oscillator can add extra proof.
Entries come when price breaks out on heavy volume. Exits occur once momentum wanes or MACD shows divergence. Smart risk management with stop-loss orders and trailing stops limits loss.
This method fits day trading and swing traders alike. Traders who track trading volume gain an edge in the Nasdaq market.
Avoid Holding Positions Overnight as a Beginner
After-hours news can swing prices fast, and your account may face a margin call. Holding stock past close brings borrowing fees, and those costs can eat gains. Risk spikes when a surprise affects trading volume.
FINRA sets a $25,000 minimum for pattern day traders, those with four or more day-trades in five business days. Many new speculators cut losses with stop-loss orders and simple risk management rules.
They run technical analysis with RSI and MACD, then close each trade by 4 p.m.
Day trading lets you avoid overnight swings, and you rest easy. You track bid and ask quotes, follow trend following signals, and use breakout trading or moving averages for entries.
Some traders sketch Fibonacci retracement lines on a chart, then exit before dusk. They keep small positions, like light backpacks, so they can move fast. This style builds trading psychology, sharpens emotional control, and cuts margin trading risk.
Reflect on Past Trades to Identify Strengths and Weaknesses
Scan your trading journal each week to spot patterns in profit or loss. You record date, asset, entry price, exit price, and trading volume in a data log. This practice boosts discipline, and it shows where risk management failed.
A technical indicator like a relative strength index (RSI) plot highlights where you nailed momentum trading and where you missed a move.
Review each loss, and each win, to learn your strong suits. Adapt your approach, when a pattern shows, say, a bias for holding too long or cutting gains short. Tracking trades in a journal builds a clear map of your skill set.
This drill helps you sharpen your trading psychology, and fine-tune your position sizing and stop-loss orders.
Utilize Trading Tools and Indicators for Better Analysis
Interactive Brokers and Webull offer real time streaming quotes for technical analysis. Candlestick charts and trend lines help you read price moves like a map. Relative strength index (RSI) acts like a mood ring for stocks.
Moving average convergence divergence (MACD) shows trend shifts fast. Trading volume and bid-ask spreads pop up in ECN quotes and Level 2 data. Nasdaq BookViewer digs into market depth for price action.
You draw Fibonacci retracement lines at key highs and lows for support and resistance. A Doji reversal with a volume spike points at potential entry. Stop-loss orders or trailing stops guard your funds.
Real time news feeds add context for momentum trading and day-trading. Paper trading on the same system builds your confidence before risking real cash.
Stay Disciplined and Avoid Chasing Losses
Traders often chase losses when emotions take over. You set your stop-loss orders before you trade. Use a daily max loss limit, like $500, and stop trading when you hit it. This rule fights endless trades, and it guards your capital.
Emotional control matters in trading psychology and risk management. You can use a technical indicator to spot trends, but you must stick to limits. Studies show 80% of day traders lose money.
A solid plan, clear exit rules, and a calm mind can beat those odds. A disciplined trader treats losses as a lesson, not a chance to get even.
Always Keep Learning and Adapting to Market Changes
Hands-on study keeps skills fresh. Webinars, CFTC reports, and white papers from the SEC feed new ideas. Logging every trade reveals patterns with a momentum oscillator or convergence divergence lines.
Expert interviews add real tips. Stop-loss orders and basic risk management tools help you control losses.
Markets shift fast. A day trading plan fails without fresh data on trading volume or moving averages. You tweak trend-following setups and adjust pullback entries after each session.
Small changes can lift returns in a Fibonacci retracement or options trading strategy. Keep learning and you stay in step with change.
Takeaways
Trading feels like a beast, but you can tame it. Candlestick charts, RSI readings, and MACD crossovers guide your moves.
Stop-loss orders shield your funds from big swings. Paper trades on Interactive Brokers or Webull sharpen your gut and your skills. Add trend following, Fibonacci retracement, and volume to tighten your grip.
You got this.
FAQs
1. What is day trading and how can I start?
Day trading means you buy and sell financial instruments in one day. You use moving averages, RSI, MACD to read price action. You watch trading volume and set stop-loss orders.
2. What are trend following and breakout trading?
Trend following means you ride a price wave like a surfer. Breakout trading means you jump in when price moves past key levels. You can use Fibonacci retracement to spot those levels.
3. What is momentum trading?
Momentum trading means you ride fast moves in the market. You use RSI or MACD to spot strength. High trading volume can confirm real speed.
4. Can beginners use options strategies?
Yes, start with simple options contracts. You watch bid-ask spreads and call market makers for quotes. Learn iron condor only after you know the basics.
5. How do I manage risk, and what role does trading psychology play?
You use stop-loss orders and set trailing stops. You avoid margin trading until you learn more. Keep your emotions in check, don’t chase losses.
6. What tools help with technical analysis?
You need charts and indicators like moving averages, MACD and RSI. You link to a trading network for live data. You can also watch market sentiment and use trend tools.