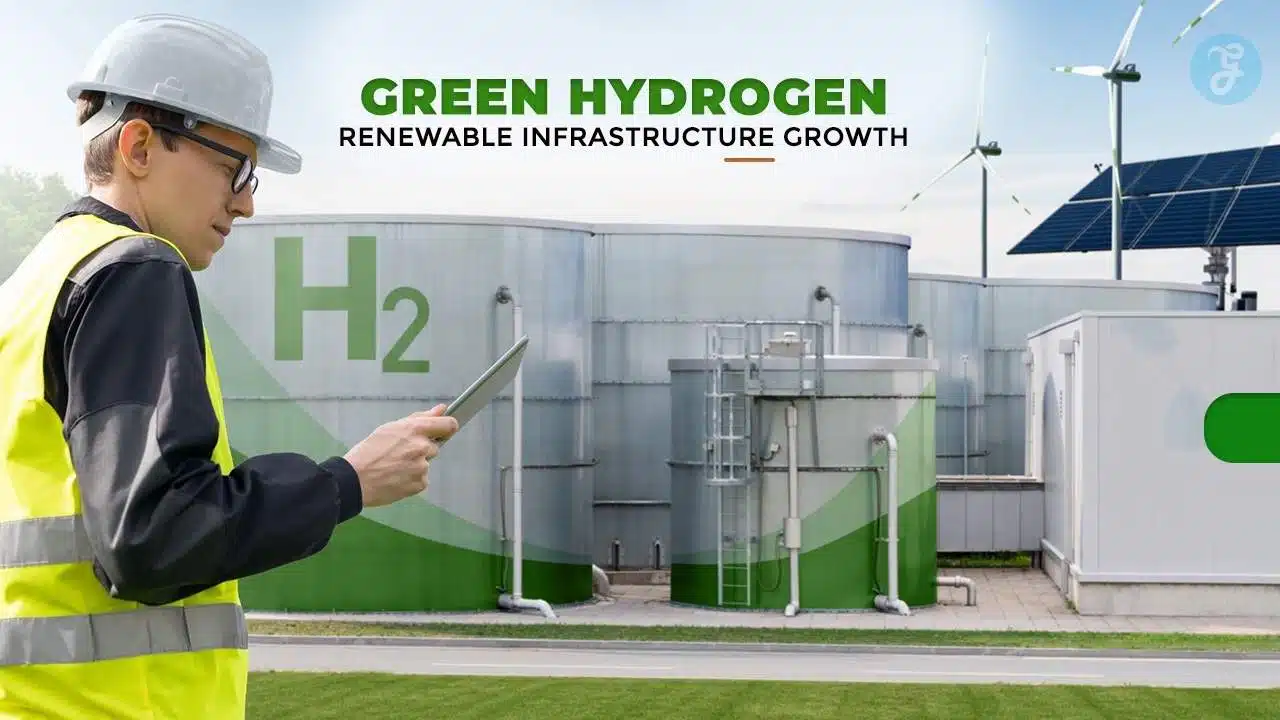
Green Hydrogen Infrastructure Scaling has definitively replaced “capacity announcements” as the primary driver of the global energy market in early 2026. For the first half of this decade, the sector was fueled by a “hype cycle” of massive gigawatt-scale production pledges, glittering promises of desert solar farms powering electrolyzers to fuel the world.
However, as the industry matures, the narrative has fundamentally shifted. The “Green Hydrogen Pivot” represents a move away from theoretical production targets toward the tangible logistics of delivery. The question is no longer just “can we make it?” but “can we move it?” This analysis explores why 2026 marks the end of the announcement era and the beginning of the infrastructure era.
Key Takeaways: The 2026 Market Outlook
- The “Pivot” Defined: The industry has shifted focus from production ambition (electrolyzers) to midstream execution (pipelines, ports, storage). 2026 is the year where success is measured by infrastructure, not announcements.
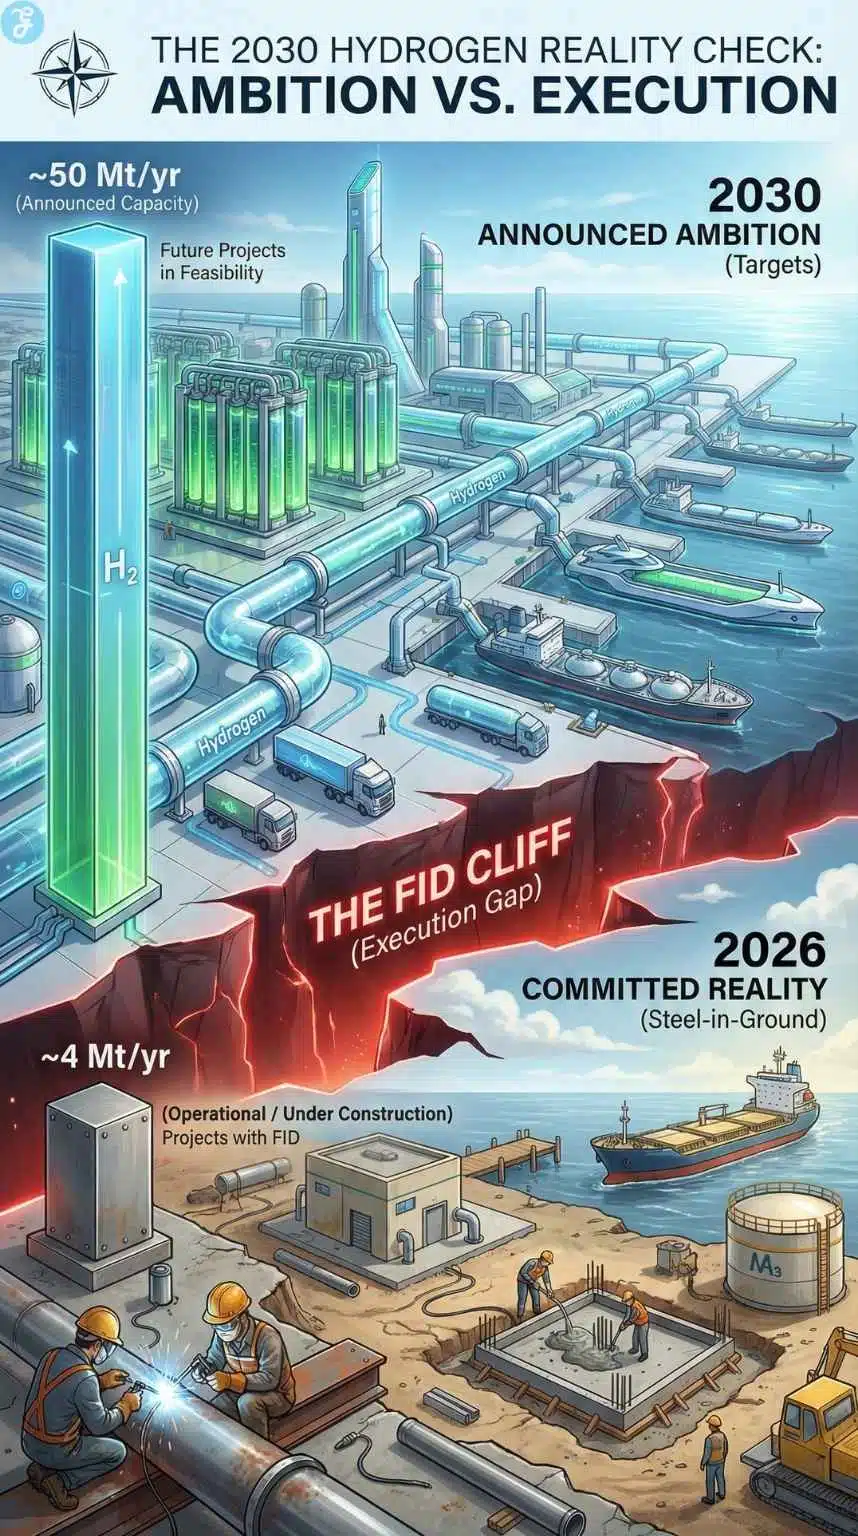
- The “FID Cliff”: A massive gap exists between 2030 targets and reality. While ~50 Mt of capacity is announced, less than 4 Mt is currently committed, as projects stall without guaranteed transport solutions.
- Logistics Double the Price: The obsession with “cheap production” ($3/kg) is over. The new metric is Delivered Cost, which often balloons to $8–$13/kg once transport, storage, and conversion are factored in.
- The “Vector War” Winner: Green Ammonia has emerged as the dominant carrier for long-distance export, beating liquid hydrogen. Conversely, hydrogen for residential heating is effectively dead, with capital shifting to industrial clusters.
- China’s Dominance: China is winning the race by integrating renewable generation, hydrogen production, and industrial use into single “super-sites,” bypassing the transport bottleneck that is stifling European projects.
From Hype to Hardware: The 2026 Reality Check
As the dust settles on the aggressive targets of previous years, the industry is facing a stark “Year of Reckoning.” The assumption that market demand would naturally follow supply announcements has been shattered by the logistical reality that hydrogen, the universe’s smallest molecule, is notoriously difficult and expensive to transport.
The urgency is driven by a collapsing timeline. According to the IEA’s Global Hydrogen Review 2025 (released late last year), the gap between political ambition and engineering reality has never been wider. While nations have pledged to produce over 48 million tonnes (Mt) of low-emission hydrogen by 2030, less than 10% of that capacity has reached a Final Investment Decision (FID).
The primary culprit is a glaring deficit in the “midstream” connective tissue, pipelines, dedicated terminals, and storage facilities. In 2026, the success of the energy transition will not be measured by who has the most efficient electrolyzer, but by who controls the infrastructure to deliver the energy from where it is made to where it is needed without doubling the cost.
The 2030 Data Landscape: Targets vs. Steel-in-Ground
To understand the magnitude of the “Pivot,” one must look at the data that shocked the industry in late 2025. The global targets set during the optimistic days of 2021-2023 envisioned a world awash in green molecules by the end of the decade. The reality of 2026 is far more sobering.
The FID Cliff
The “FID Cliff” is the industry’s most daunting chart. As of January 2026, the global project pipeline boasts over 1,500 announced projects. However, a mere fraction has broken ground.
- Announced Ambition: ~50 Mt per year by 2030.
- Committed Reality: ~4 Mt per year currently operational or under construction.
This discrepancy reveals that nearly 80% of projects are stuck in a “feasibility purgatory.” They are paused not because the technology doesn’t work, but because developers cannot secure long-term off-take agreements. Buyers are unwilling to sign 15-year contracts for hydrogen that has no guaranteed transport route.
The Great Cull of 2025
The latter half of 2025 saw a wave of cancellations that served as a market correction. High-profile projects that lacked integrated infrastructure were the first to fall.
- Australia: The massive CQ-H2 export project faced severe headwinds as costs ballooned, leading partners to withdraw. The dream of shipping liquid hydrogen globally remains technically fraught and economically unproven.
- Europe: In Germany and the UK, major industrial players like ArcelorMittal and Air Products scaled back or cancelled green steel and import terminal plans, citing a lack of subsidy support and regulatory clarity.
However, amidst the cull, a new breed of “infrastructure-first” projects has emerged. These survivors, mostly in China and parts of the Middle East, didn’t just plan a hydrogen plant; they planned the power lines, the pipelines, and the industrial clusters simultaneously. This integrated approach is the only model surviving the scrutiny of 2026.
The “Gold” Rush: Can Natural Hydrogen Skip the Electrolyzer?
While the industry focuses on building electrolyzers, a geological wildcard has emerged in early 2026. On January 16, Canadian explorer Max Power confirmed the discovery of a natural hydrogen system in Saskatchewan, joining a growing list of “White Hydrogen” finds from Mali to France.
Unlike “Green” hydrogen (which requires manufactured energy), White Hydrogen is naturally generated by the Earth’s crust. If these reserves prove commercially viable, they represent the ultimate “Pivot”, bypassing the need for renewable generation entirely and turning hydrogen into a traditional drilling and extraction game. For investors, the risk is real: a $1/kg natural supply could undercut $5/kg manufactured green hydrogen, potentially turning expensive electrolyzer plants into stranded assets.
The Infrastructure Bottleneck: Why “Midstream” is the New King
The “Pivot” is ultimately a story about physics. Green hydrogen is produced in sunny or windy remote locations (the Australian outback, the Chilean desert, the windy North Sea), but it is consumed in dense industrial heartlands (the Ruhr valley, East Asian ports). Bridging this gap is the defining challenge of the decade.
The Pipeline Paradox
Pipelines are the most efficient way to move hydrogen, but they are also the hardest to build.
- Repurposing Woes: The European Hydrogen Backbone (EHB) initiative, once touted as a quick fix, has hit technical speed bumps. Repurposing existing natural gas pipelines is possible but requires extensive retrofitting to prevent “embrittlement” (where hydrogen weakens the steel) and massive compressor upgrades. Regulatory battles over who pays for this upgrade, gas grid operators or hydrogen developers, have stalled progress in 2025.
- New Builds: Building dedicated hydrogen pipelines faces the same “NIMBY” (Not In My Backyard) opposition as oil pipelines, compounded by the high cost of specialized materials.
Maritime Transport: The Ammonia Pivot
Because shipping liquid hydrogen (LH2) requires chilling it to near absolute zero (-253°C), the industry has largely abandoned LH2 for long-distance transport in favor of Green Ammonia (NH3).
- The Winner: Ammonia is liquid at a manageable -33°C and has an existing global supply chain. In 2026, we are seeing a surge in orders for ammonia-ready vessels.
- The Hidden Cost: The “Pivot” to ammonia comes with a catch: Cracking. To use the hydrogen at the destination (e.g., for fuel cells), the ammonia must be “cracked” back into hydrogen and nitrogen. This process is energy-intensive and expensive, requiring massive new “cracking terminals” at ports like Rotterdam and Hamburg, infrastructure that largely does not exist yet.
The “Hidden Cost”: Why Infrastructure Matters
This effectively visualizes why the Delivered Cost is so much higher than the production cost, reinforcing the article’s main thesis.
| Cost Component | Estimated Cost ($/kg) | Explanation |
| 1. Production (LCOH) | $3.50 – $6.00 | The cost to make H2 at the plant (electrolyzer + solar/wind power). |
| 2. Conditioning | +$1.50 – $2.50 | Converting gas to liquid (ammonia/LH2) for transport. |
| 3. Shipping/Transport | +$2.00 – $3.00 | Moving the molecule from the source (e.g., Chile) to the buyer (e.g., Germany). |
| 4. Reconversion | +$1.00 – $2.00 | “Cracking” ammonia back into hydrogen (if needed) at the destination port. |
| TOTAL DELIVERED COST | $8.00 – $13.50 | The Reality: The final price the buyer actually pays is double the production cost. |
The Water Tax: Why Desalination is the Silent Partner of 2026
The infrastructure gap is not limited to pipes. A frequently overlooked bottleneck in 2026 is water. Producing 1 kg of green hydrogen requires roughly 9 kg of ultra-pure water. With the most promising projects located in arid regions like Namibia, Saudi Arabia, and the Australian Outback, developers are facing a new reality: they are no longer just energy companies; they must become water companies.
2026 has seen a surge in “integrated CAPEX” models where desalination units account for a rising percentage of project costs. The “Pivot” to infrastructure now demands that water permits be secured before energy permits, adding another layer of complexity to the FID process.
The “Course Correction” Update: Residential Heating Dead End
To fully understand the “Infrastructure Pivot” of 2026, one must also look at where the pipes are not going. For the first half of the decade, a significant portion of industry hype and lobbying budget was dedicated to the idea of “blending” hydrogen into the residential gas grid to heat homes.
As of early 2026, this pathway is effectively a dead end. The industry has quietly conceded that the battle for residential heating has been lost to electrification (heat pumps), and capital is shifting accordingly.
- The Trial Cancellations: The clearest signal came from the UK, once the global poster child for hydrogen heating. Following the cancellation of the “hydrogen village” trials in Redcar and Whitby (due to fierce local opposition and supply issues), the government’s promised “2026 Strategic Decision” on hydrogen heating has largely become a formality of rejection. The concept of pumping explosive gas into millions of kitchens has proven politically toxic and economically unviable.
- The Thermodynamics of Failure: The pivot away from heating is driven by “efficiency physics.” Using renewable electricity to make hydrogen, pumping it to a home, and burning it in a boiler is approximately five to six times less efficient than using that same electricity directly in a heat pump. In a 2026 market focused on “Delivered Cost,” this energy penalty is unacceptable.
- Infrastructure Implication: This “course correction” is vital for investors. It means the “Gas Distribution Networks” (the small pipes under city streets) will largely not be repurposed for hydrogen. Instead, the “Midstream Pivot” is strictly focused on Transmission Backbones, the high-pressure arterial pipes connecting ports to industrial clusters. The dream of a ubiquitous “hydrogen grid” replacing the natural gas grid block-by-block is over; the new reality is a targeted “industrial super-highway.”
Regional Power Dynamics: The Divergence
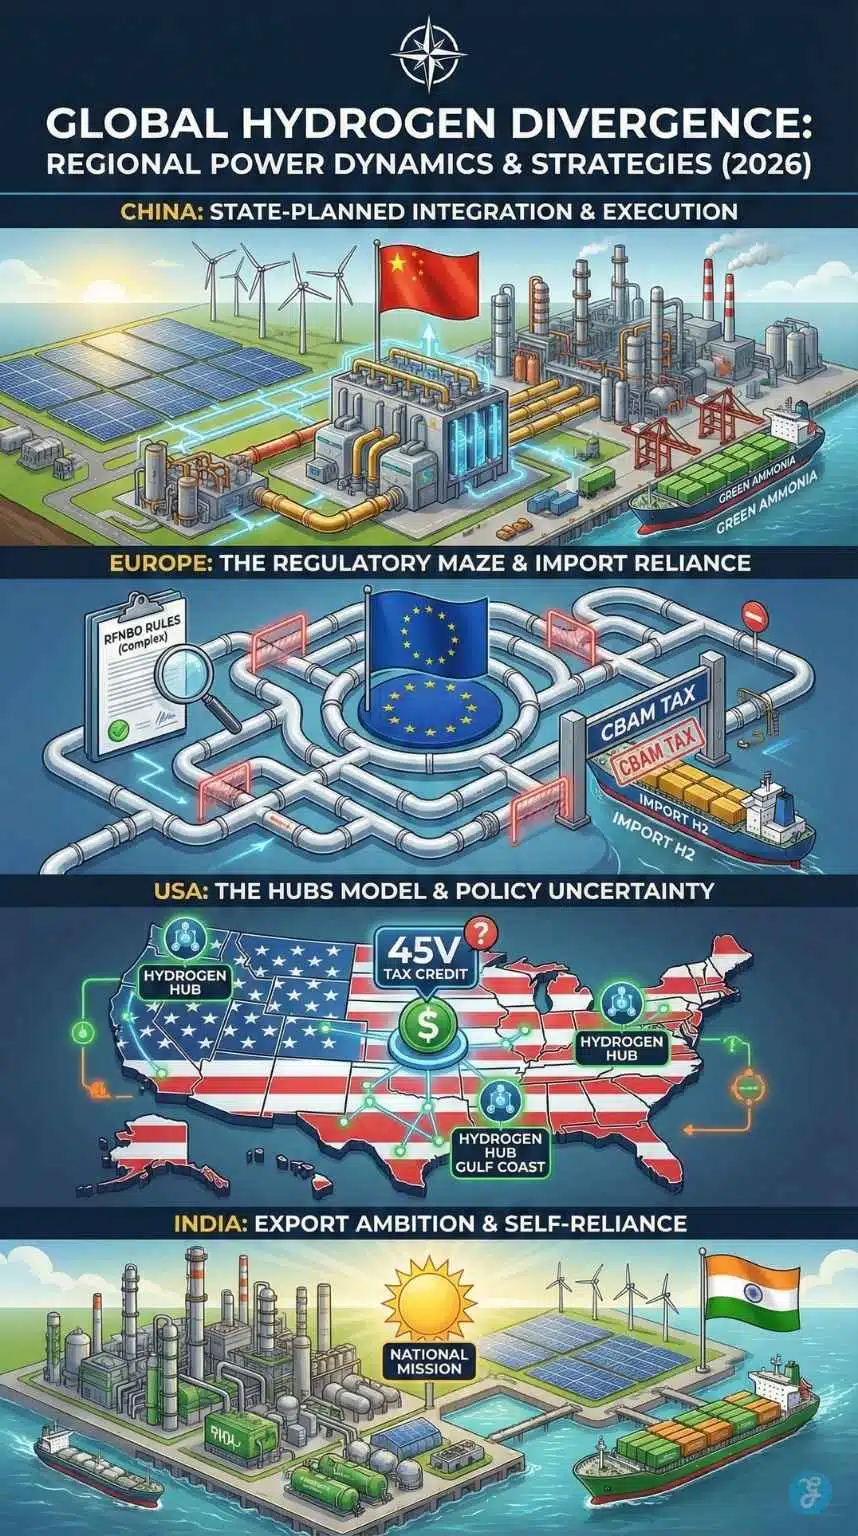
The “Green Hydrogen Pivot” is not happening evenly across the globe. A sharp divergence has emerged between nations that can state-plan infrastructure and those relying on market forces.
China: The Execution Machine
China is the undisputed winner of the 2026 landscape. While the West debates regulations, China is pouring concrete.
- Integrated Clusters: China’s strategy ignores the transport problem by moving the industry to the energy. In Inner Mongolia and Xinjiang, massive “Green Chemical Clusters” have been built where solar farms feed directly into electrolyzers and then immediately into ammonia or methanol plants.
- Tech Dominance: By controlling 60% of global electrolyzer manufacturing, Chinese firms have pushed capital costs down by 40% compared to Western competitors. In 2026, European developers are increasingly quietly buying Chinese tech to make their project economics work, despite political friction.
Europe: The Regulatory Maze
The European Union is struggling to maintain its early lead. The bloc’s sophisticated but complex regulations, specifically the RFNBO (Renewable Fuels of Non-Biological Origin) rules, have acted as a brake on development.
- The “Additionality” Trap: Rules requiring hydrogen to be produced only from new renewable capacity (to avoid cannibalizing the grid) have made project financing incredibly complex.
- The 2026 Outlook: Facing the risk of missing its 2030 targets entirely, analysts expect the EU to “soften” some of these requirements in 2026, perhaps allowing more flexibility to jumpstart the stalled pipeline. The “Dragon in the Grid” report recently highlighted Europe’s dangerous reliance on Chinese components, adding a layer of geopolitical anxiety to the energy transition.
The “Rules of the Game”: Global Policy Comparison
This table instantly clarifies the confusing differences between the major powers.
| Region | Key Policy / Strategy | 2026 Status | Strategic Focus |
| China | State-Planned Integration | Leader: Rapid execution via state-owned enterprises (SOEs). Integrating renewables + H2 + Industrial use in one site. | Domestic Execution: Building massive “Chemical Clusters” to dominate the supply chain. |
| European Union | RFNBO & CBAM | Struggling: Complex “additionality” rules slowed projects. High reliance on imports. | Regulation: Using carbon taxes (CBAM) to force demand, while trying to fix supply bottlenecks. |
| USA | Inflation Reduction Act (45V) | Uncertain: Post-election shifts have created anxiety over tax credit rules ($3/kg). | Hubs Model: Creating regional “Hydrogen Hubs” to localize supply and demand. |
| India | National Green Hydrogen Mission | Rising: Focus on replacing “grey” hydrogen in refineries and fertilizer plants. | Export & Self-Reliance: Aiming to become a low-cost exporter of Green Ammonia. |
North America: The “Hub” Strategy
The United States is betting on a “Hubs” model, regional clusters (like the Gulf Coast or Pacific Northwest) that localize production and use.
- Post-Election Uncertainty: The political shifts following the 2024 election have injected uncertainty into the implementation of the Inflation Reduction Act’s (IRA) 45V tax credits. Developers are pausing to see if the lucrative $3/kg subsidy remains intact or gets diluted.
- Blue vs. Green: The US is more pragmatic about “Blue Hydrogen” (gas with carbon capture). 2026 sees a resurgence of Blue Hydrogen projects in Texas as a faster way to build export volumes while Green tech matures.
The Economics of the Pivot: LCOH vs. Delivered Cost
For years, the industry obsessed over the Levelized Cost of Hydrogen (LCOH), the cost to produce a kilogram at the plant gate. The target was $2/kg. In 2026, this metric is increasingly irrelevant.
The Delivered Cost Shock
The new metric that matters is Delivered Cost.
- Production: ~$3.50 – $6.00/kg (Green Hydrogen in 2026).
- Transport & Storage: Adds $4.00 – $6.00/kg.
- Final Price: Buyers are looking at $8.00 – $12.00/kg for delivered green hydrogen in Europe or Japan.
This doubling of cost due to logistics is the “cold shower” driving the Pivot. It is why projects are failing. A steel mill cannot compete globally if its energy cost is four times higher than that of a competitor using coal.
The “Green Premium” Standoff
This economic reality has created a standoff. Offtakers (buyers) are willing to pay a small “Green Premium” for sustainable fuel, but not a 300% markup.
- Bridging the Gap: Governments are realizing that subsidies for production (like the US 45V) are not enough. There needs to be support for infrastructure and contracts for difference (CfDs) that cover the gap between the grey and green price.
- Consolidation: The high interest rates of 2024-2025 wiped out the startup model. The sector is consolidating around super-majors (Shell, BP, TotalEnergies, Sinopec), who have the balance sheets to absorb these infrastructure costs and wait a decade for returns.
The 2026 Transport “Vector War”
| Vector | Pros | Cons | 2026 Status |
| Green Ammonia (NH3) | High volumetric energy density; utilizes established global shipping and port infrastructure. | Highly toxic; requires energy-intensive “cracking” at destination to reconvert to H2. | WINNER: The default choice for long-haul export (e.g., MENA to Europe). |
| Liquid Hydrogen (LH2) | Purest form; no chemical reconversion or “cracking” required at destination. | Requires cryogenic cooling to -253°C (near absolute zero); significant “boil-off” losses during transit. | LAGGING: Major export projects (e.g., Australia) stalled or cancelled due to technical immaturity and cost. |
| LOHC (Liquid Organic) | Safe, non-toxic oil-like liquid; compatible with existing oil tankers and fuel depots. | transporting the carrier liquid (“dead weight”) is expensive and energy-intensive to release the hydrogen. | NICHE: Gaining traction for localized, shorter-distance transport (e.g., within Europe via barge/truck). |
Sector Analysis: Who is Buying?
If the delivered cost is high, who is actually buying green hydrogen in 2026? The demand is narrowing to sectors that have no other choice.
Steel: The Flagship
Green steel remains the most promising demand center. In Europe, the Carbon Border Adjustment Mechanism (CBAM), fully operational in 2026, is forcing importers to pay for carbon emissions. This policy stick is making green hydrogen-based steel (DRI) competitive, not because hydrogen is cheap, but because carbon is expensive.
Shipping: The Methanol & Ammonia Wave
The maritime sector is the fastest mover. The International Maritime Organization (IMO) targets are biting.
- Methanol First: Maersk and others have already launched fleets running on green methanol.
- Ammonia Next: 2026 is seeing the first large-scale trials of ammonia-fueled engines. Shipping companies are more willing to pay the “Green Premium” because fuel is a pass-through cost to consumers.
Fertilizer: The Floor
The “lowest hanging fruit” remains fertilizer. Replacing the “grey” hydrogen used in ammonia production with “green” hydrogen requires no new end-use technology. This is where the massive Indian and Middle Eastern projects are focusing, decarbonizing their own fertilizer exports to Europe to avoid CBAM tariffs.
Strategic Recommendations for 2026-2030
The path to 2030 is narrow, but still open. To navigate the “Green Hydrogen Pivot,” stakeholders must adapt immediately.
- For Policymakers: Stop obsessing over “gigawatts of electrolyzers.” Shift funding to the boring stuff: pipelines, storage caverns, and port upgrades. The infrastructure is the multiplier. Without it, the electrolyzers are stranded assets. Also, simplify the “green” rules; perfection is the enemy of progress.
- For Developers: Abandon the “island” model. If your project relies on shipping liquid hydrogen halfway across the world, it is likely dead. Pivot to local clusters (use where you produce) or switch to ammonia/methanol as the carrier immediately.
- For Investors: Look past the tech hype. The value in 2026 is in the midstream logistics companies, the ones that own the pipes and the terminals, and the “picks and shovels” of the industry (compressors, valves, storage tanks).
Final Words: The “Make or Break” Window
The “Green Hydrogen Infrastructure Scaling” of 2026 is not a sign of failure; it is a sign of growing pains. The industry is moving from the playground to the construction site.
The window to influence 2030 is closing. Large infrastructure projects have lead times of 3-5 years. If the pipelines are not permitted and the terminals are not financed by the end of 2027, the 2030 targets will be mathematically impossible to meet.
We are entering the “hard yards” of the energy transition. The press releases will be fewer, the glamour will fade, but the amount of steel going into the ground will finally, hopefully, start to rise. The “Green Hydrogen Pivot” is the industry’s last, best hope to turn a decade of promises into a decarbonized reality.