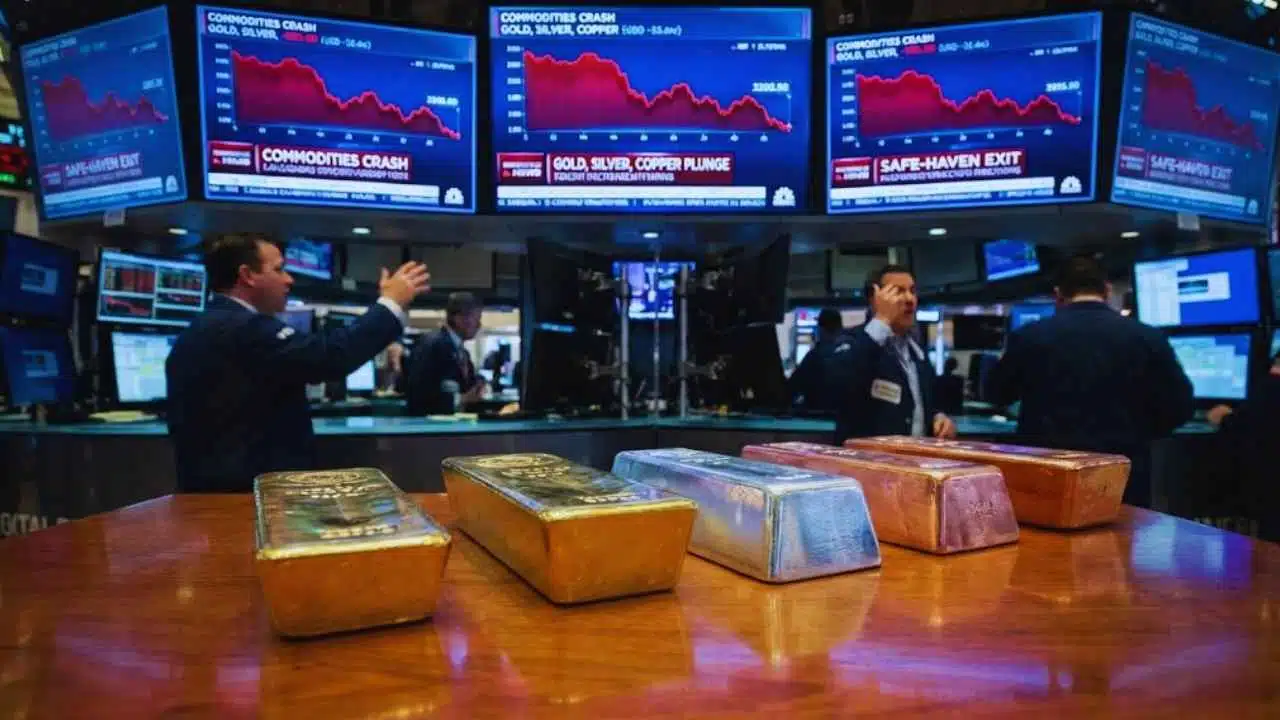
Gold, silver, and copper fell sharply on December 29, 2025, after touching fresh records earlier in the session, as traders rushed to lock in gains and reduce leveraged positions during thin year-end trading.
What Happened on December 29
A powerful late-December rally in precious and industrial metals reversed abruptly on December 29, with steep intraday drops in both global and Indian markets.
- Silver saw the biggest shock, sliding hard after an all-time high as leveraged positions unwound.
- Copper dropped after record levels, as the market cooled following a surge driven by supply and electrification themes.
- Gold slipped from near-record highs as safe-haven demand eased and profit-taking intensified.
India Snapshot: MCX Moves (Intraday)
| Metal (Contract) | Record/Peak Level (₹) | Low/Last Mentioned Level (₹) | Approx. Intraday Move |
|---|---|---|---|
| Silver (Mar) | 2,54,174/kg | ~2,33,120/kg | -8% (approx.) |
| Copper | 1,392.95/kg | 1,211.05/kg | -13% (approx.) |
| Gold (Feb) | Near record zone | ~1,37,646/10g | ~-2% (approx.) |
Note: Prices reflect intraday levels reported across trading updates on December 29.
Why Did Metals Fall So Fast? Four Forces Hit at Once
The selloff wasn’t driven by one headline. It was the result of multiple catalysts converging during a low-liquidity, year-end session—an environment that often exaggerates moves.
1. Peace Optimism Reduced Safe-Haven Demand
Gold and silver had climbed through 2025 partly because geopolitical risk remained elevated. But by late December, traders began reacting to fresh optimism around Russia–Ukraine diplomacy.
A widely watched meeting between U.S. President Donald Trump and Ukrainian President Volodymyr Zelenskyy on December 28 increased expectations—at least in market terms—that the conflict could move toward a negotiated framework. Even modest progress signals can spark rapid repositioning when prices are stretched.
When investors expect lower geopolitical risk, they often rotate away from traditional “fear assets” like gold and silver—especially after a major run-up.
2. CME Margin Hikes Forced Leveraged Traders to Cut Positions
The most immediate mechanical trigger was higher margin requirements for silver futures. When an exchange raises margins, traders must post more capital to hold the same position. Those unable—or unwilling—to add funds often liquidate quickly.
That liquidation can create a cascade effect:
- Falling prices trigger stop-losses
- Stop-losses accelerate selling
- Volatility rises further
- More traders reduce risk before the close
This kind of forced selling is especially impactful after a parabolic move, when positioning becomes crowded and speculative.
3. China’s Silver Export Licensing Rules Added Another Shock to the Narrative
China announced a tighter export framework for tungsten, antimony, and silver for the 2026–2027 period, including licensing requirements and eligibility standards for state-trading exporters.
In theory, tighter export controls can support prices by tightening global supply. But in practice, markets often react in two phases:
- Phase 1 (Immediate): uncertainty, recalibration, profit-taking
- Phase 2 (Longer-term): pricing in actual supply impacts once implementation becomes clearer
So even though restrictions could be bullish longer-term, the near-term effect can be volatile as traders reassess how quickly the policy changes real-world supply flows.
4. Overheated Technicals and Year-End “Book Squaring” Fueled Profit-Taking
After extreme gains in 2025, many traders entered the final week of December sitting on large profits. That created strong incentives to:
- close positions to lock gains,
- reduce risk ahead of a new calendar year,
- and avoid being caught in a reversal during thin holiday liquidity.
This is classic “book squaring,” and it becomes more powerful when prices look technically extended.
How Big Was the Rally Before the Crash?
The correction came after a historic run:
Global Record Levels Reached in Late December
| Metal | Late-December Peak | 2025 Theme Behind the Run |
|---|---|---|
| Gold | Above $4,500/oz (record zone) | Safe-haven demand, rate expectations, strong investor flows |
| Silver | Near/above $80/oz (record zone) | Supply concerns + industrial demand + speculative momentum |
| Copper | Near $13,000/ton (record zone) | Electrification demand + supply constraints + tight inventories |
Silver’s gains drew particular attention because it behaves like a hybrid: part precious metal, part industrial input. When it rallies too fast, industrial users may delay purchases, while leveraged funds amplify volatility—creating the conditions for abrupt reversals.
Copper’s Slide: Not Just Profit-Taking
Copper’s drop was sharp, but the backdrop remains structurally important.
Copper demand is tied closely to:
- power grids,
- EVs and charging networks,
- renewable energy infrastructure,
- data centers and industrial expansion.
At the same time, mining supply expansion remains slow, and disruptions can quickly tighten the market. That’s why copper can surge on forward-looking scarcity fears—then correct violently when traders de-risk.
In other words, the December 29 move looked less like a collapse in copper’s long-term story and more like a reset after a crowded rally.
Ripple Effect: Metal Stocks Cool After a Strong Run
The commodity reversal spilled into equities, especially metal and mining counters that had rallied for multiple sessions.
In India, several major metal names pulled back, and the broader metal index eased off highs. These stocks often act as a “leveraged” expression of commodity moves—rising faster during rallies and falling faster during corrections.
What It Means for Investors and Traders
For Traders
- Margin-driven moves can be violent and fast.
- Volatility tends to spike when liquidity is thin, especially at year-end.
- Overextended rallies often correct sharply even without a major fundamental change.
For Long-Term Investors
-
A pullback doesn’t automatically end the longer-term trend.
-
The 2026 outlook will likely depend on:
- real interest rate direction,
- currency moves,
- geopolitics,
- and industrial demand (especially for silver and copper).
Key Risks to Watch Next
- Further margin changes if volatility remains extreme
- Confirmation (or breakdown) of peace negotiations
- Clarity on China’s export licensing rollout and enforcement
- Demand signals from solar, electronics, EV, and grid spending
A Reset After an Extraordinary Run
December 29 looked like a classic late-cycle shakeout: profit-taking met forced liquidation, headlines reduced safe-haven urgency, and policy uncertainty jolted the market.
If volatility continues into early January, markets may try to establish a new trading range—especially for silver and copper. Gold’s next move will likely hinge on whether investors continue treating geopolitical risk and monetary policy as supportive, or whether the rally has simply outrun near-term fundamentals.