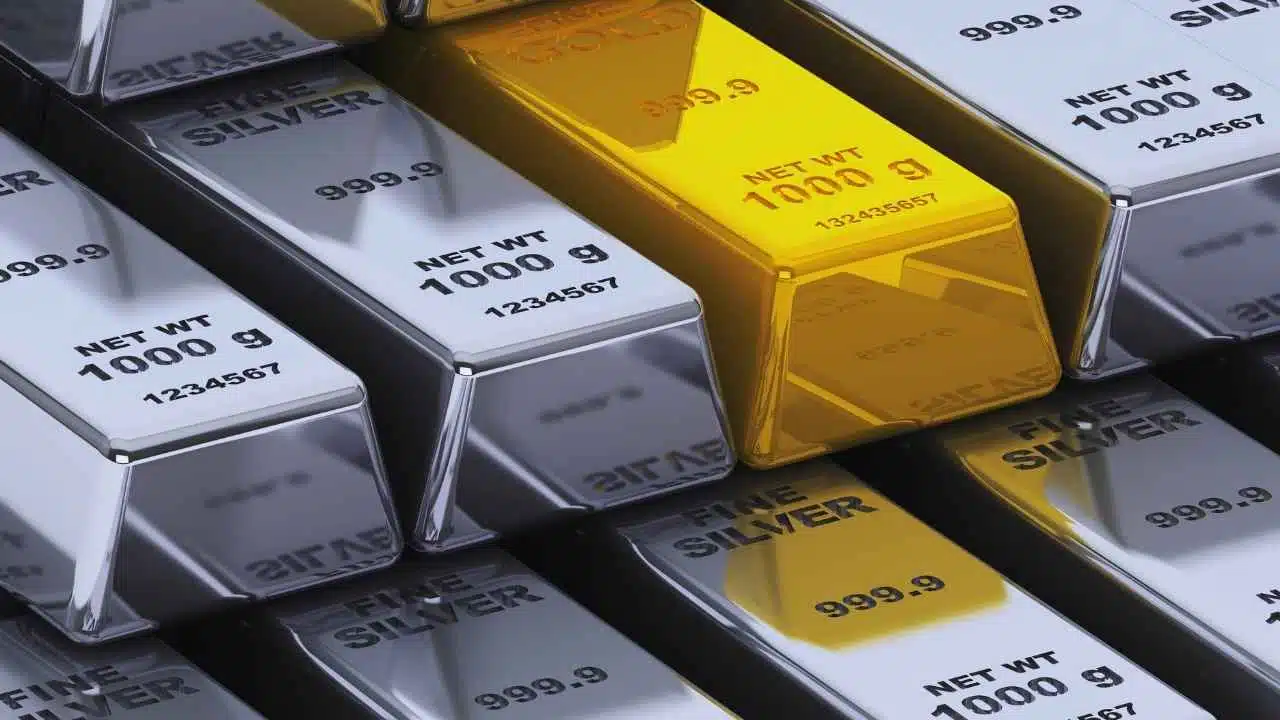
Gold and silver all-time highs were set on December 26, 2025, as spot gold briefly touched about $4,549/oz and spot silver climbed to about $78.53/oz, extending a powerful year-end rally fueled by easing-rate expectations and tight physical balances.
What happened and where prices stand now?
Gold and silver ended late December with a dramatic burst higher, pushing both metals to fresh records in global spot trading. Gold’s intraday peak near $4,549 per ounce underscored how aggressively investors have been willing to pay for perceived safety and liquidity. Silver’s surge was even sharper, reaching about $78.53 per ounce and reminding markets that silver’s smaller size can translate into larger daily swings.
The rally was not limited to gold and silver. Platinum and palladium also jumped strongly at the same time, reinforcing the view that investors were rotating broadly into precious metals during thin year-end liquidity.
Record snapshot (spot prices cited in the late-December surge)
| Metal | Approx. intraday record/peak | Date highlighted |
| Gold | ~$4,549.71/oz | Dec 26, 2025 |
| Silver | ~$78.53/oz | Dec 26, 2025 |
| Platinum | ~$2,454.12/oz | Dec 26, 2025 |
| Palladium | ~$1,924.03/oz | Dec 26, 2025 |
In relative terms, the move also compressed the gold–silver ratio (gold price divided by silver price). Using the peaks above, the ratio was roughly 58:1, far tighter than the 80:1 to 90:1 range that dominated much of 2024 in many market commentaries. A falling ratio usually means silver is outperforming gold—something that can happen when industrial demand and scarcity concerns collide with safe-haven buying.
Why gold is climbing: rate cuts, reserve demand, and hedging behavior?
Gold’s climb into new territory reflects a familiar mix of macro forces, plus a few 2025-specific accelerants.
One key driver has been expectations that interest rates are headed lower. Gold does not pay interest, so it often looks more attractive when investors believe cash and bond yields will fall. In December, the U.S. Federal Reserve cut its benchmark rate by 0.25 percentage points to a 3.5%–3.75% range, marking a third consecutive rate cut and reinforcing the market’s belief that policy has shifted from fighting inflation toward protecting growth and employment.
Gold has also benefited from central bank demand that remained strong even as prices rose. Official sector buying is watched closely because it tends to be strategic and long-term rather than short-term trading. In 2025, multiple central banks continued to increase gold reserves as part of diversification strategies—often framed by markets as a response to geopolitical risk, sanction concerns, and long-run currency credibility debates.
A third pillar is investment flows, especially through exchange-traded products (ETPs/ETFs) and physical bars and coins. When ETFs turn into consistent net buyers, they can add meaningful incremental demand because they source metal into vaults rather than rotating existing inventory.
Gold demand indicators frequently cited by market trackers (Q3 2025 reference point)
| Indicator (Q3 2025) | Approx. figure often cited | Why it matters |
| Total gold demand (incl. OTC) | ~1,313 tonnes | Shows broad strength even at high prices |
| Central bank buying | ~220 tonnes | Signals strategic reserve accumulation |
| ETF inflows | ~222 tonnes | Reflects returning investor appetite |
| Bar & coin demand | ~316 tonnes | Indicates retail and wealth demand resilience |
Gold’s move has also been amplified by year-end market mechanics. Liquidity can thin sharply around late December due to holiday closures, reduced staffing, and risk limits. In thin markets, orders can have an outsized impact—helping explain why precious metals can “gap” higher even without a single new headline.
Finally, gold’s long-standing role as a portfolio hedge remains central. Investors use it to diversify exposure to equities, credit risk, and currency volatility. When uncertainty rises—whether from inflation persistence, growth scares, or geopolitical shocks—gold often captures part of the defensive allocation.
Why silver is exploding: industrial demand, deficits, and “critical mineral” status?
Silver has always been a hybrid: part precious metal, part industrial input. In 2025, that hybrid identity helped it outperform.
The most direct explanation is the market’s persistent supply–demand deficit. Industry surveys have projected that silver demand has exceeded supply for several consecutive years, forcing the market to lean on above-ground inventories. When prices rise sharply, it is often because investors fear that inventories are no longer comfortably abundant, or that sourcing physical metal quickly could become more difficult.
A widely cited supply-and-demand table for silver shows the deficit remains large:
Silver supply vs. demand (industry survey estimates)
| Year | Total supply (million oz) | Total demand (million oz) | Market balance (million oz) |
| 2024 | ~1,015.1 | ~1,164.1 | ~-148.9 |
| 2025F | ~1,030.6 | ~1,148.3 | ~-117.6 |
Industrial demand is the second major engine. Silver is used in electronics, power systems, medical equipment, and especially in solar manufacturing (photovoltaics). Even modest changes in industrial consumption can matter because the physical market is smaller than gold’s, and because mining supply does not respond instantly to higher prices.
Industrial demand components often highlighted
| Component (2024 reference) | Approx. demand (million oz) | What’s driving it |
| Industrial demand (total) | ~680.5 | Electrification, electronics, manufacturing |
| Electrical & electronics | ~460.5 | Devices, infrastructure, connectors |
| Photovoltaics (solar) | ~197.6 | Solar deployment and capacity additions |
A third, more policy-oriented factor is silver’s inclusion on the U.S. 2025 List of Critical Minerals, published by the Department of the Interior through the U.S. Geological Survey. The label does not automatically tighten supply, but it can accelerate attention on supply-chain security, domestic processing, and strategic stock considerations—especially when demand is tied to energy transition technologies.
Silver’s speed is also explained by market structure. Compared with gold, silver is more prone to volatility because it is less deep, and because investment flows can swing the balance quickly. When momentum accelerates, silver can become a “catch-up” trade where buyers rush in to avoid missing the move.
What it means for consumers, businesses, and investors?
Record prices create winners and losers depending on where you sit in the chain.
For consumers, higher gold prices typically mean more expensive jewelry and higher premiums for small retail bars and coins. In many countries, local prices also reflect currency moves and taxes. If the domestic currency weakens against the U.S. dollar, local gold prices can rise even faster than global spot prices. In Bangladesh and other import-reliant markets, that can show up as sudden jumps in retail prices for common purity levels and weights.
For businesses, silver is often more consequential than gold because it is a key industrial input. If silver remains elevated, manufacturers may face higher costs—especially in electronics and solar supply chains. Some firms hedge or pass costs to customers, but fast price spikes can still pressure margins, slow production schedules, or change sourcing strategies.
For investors, record highs can be both a validation and a warning. The validation is that the metals have delivered strong performance during uncertainty. The warning is that late-stage rallies can become crowded, and volatility can rise sharply—particularly in silver.
Investors commonly access precious metals through several routes:
- Physical metal (bars/coins): direct ownership, but storage and premium costs matter.
- ETFs/ETPs: convenient exposure, but investors should understand structure and fees.
- Mining stocks: operational leverage to metal prices, but also company and jurisdiction risk.
- Futures/options: efficient but complex, with higher risk and potential for forced liquidation.
Because gold and silver behave differently, portfolio outcomes can vary. Gold tends to be steadier and more tied to macro hedging. Silver can deliver bigger upside in booms—but can also fall faster in risk-off periods if industrial demand weakens.
What to watch next: signals that could extend—or cool—the rally?
The next phase for precious metals will likely depend on whether today’s drivers stay in place.
1) The interest-rate path and real yields
If markets continue to expect rate cuts or weaker growth, gold can stay supported. If inflation re-accelerates and forces policymakers to pause, the trade may become more volatile.
2) Central bank and ETF flows
Steady official-sector buying and sustained ETF inflows can add durable support. A slowdown would not automatically end the bull trend, but it would remove a key pillar of incremental demand.
3) Physical tightness and inventories in silver
Silver’s deficit narrative is powerful, but markets will watch whether higher prices pull out more recycling, encourage substitution, or curb discretionary demand. Any sign that inventories are comfortable again could cool the pace of gains.
4) Industrial demand momentum
Solar and electrification trends matter for silver. If global manufacturing slows or if solar supply chains shift to reduce silver intensity, that can change the outlook.
5) Liquidity and positioning
Late-December moves often happen in thinner markets. As liquidity normalizes in early 2026, price discovery can look different. A rally that is mostly momentum-driven can retrace quickly if large holders take profits.
The surge to gold and silver all-time highs highlights how investors are pricing a world where policy easing, geopolitical uncertainty, and supply-chain sensitivity can exist at the same time. Gold’s rally reflects macro hedging and sustained institutional demand, while silver’s outsized jump points to a market that investors increasingly see as structurally tight and industrially essential. The next chapters will be written by policy decisions, flow data, and whether physical supply keeps up with a rapidly expanding use-case for silver in modern technology.