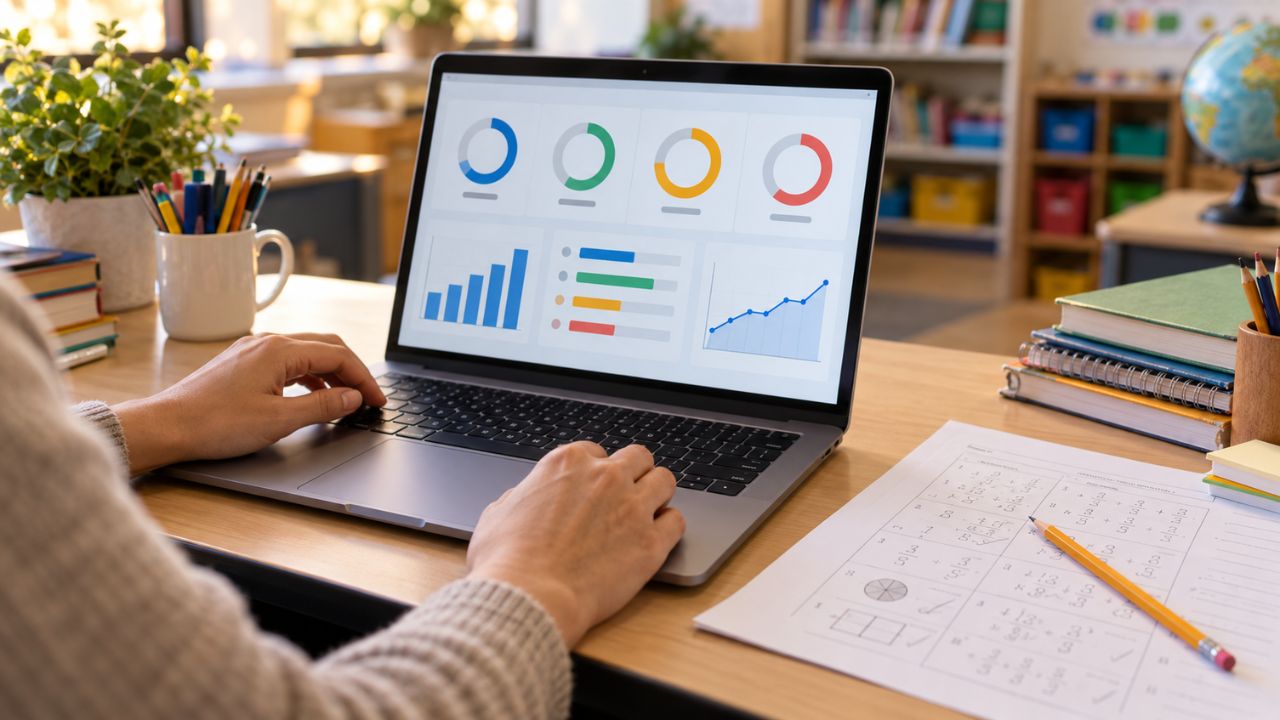
A teacher checks a dashboard and notices that a student has missed two assignments and barely opened the course website this week. The pattern is worth a closer look. The student may also have spent hours reading, working on paper, or talking through a problem away from the screen.
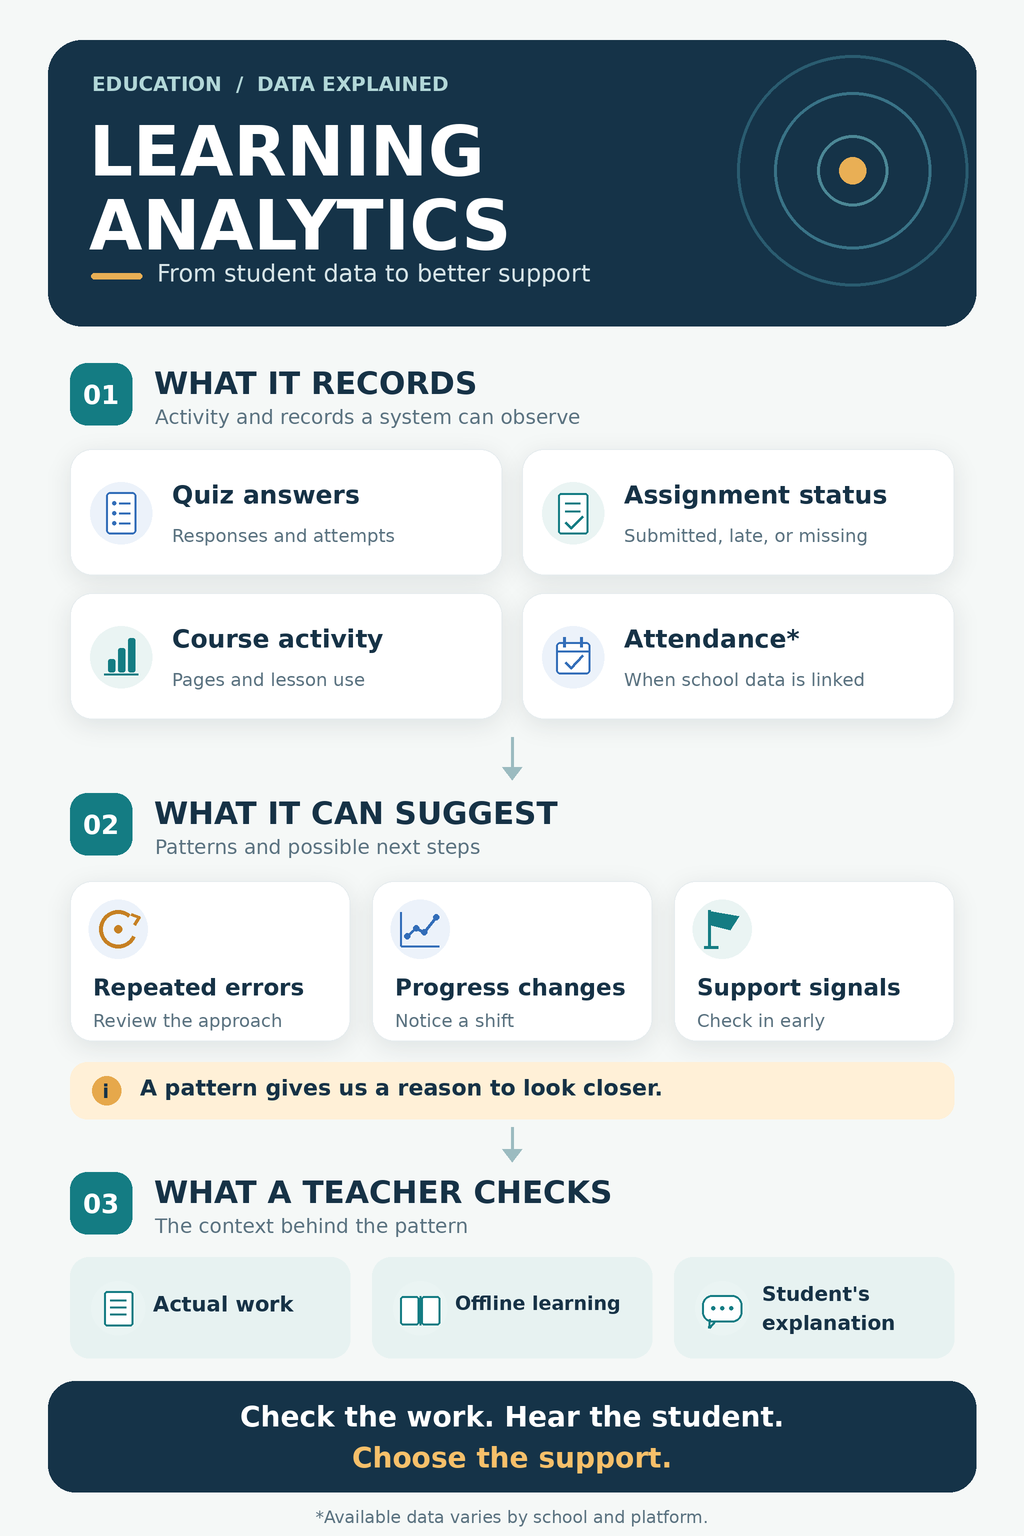
Learning analytics uses data about students and their learning to help teachers and students make better decisions. It can show quiz results, submission patterns, and activity in digital lessons. Some systems also bring in attendance or other school records. They may turn those records into progress reports or alerts about students who could need support.
The useful question is what the data actually shows. A system can record that a page was opened. It cannot tell from that event alone whether the student understood it.
What is learning analytics?
Teachers have always looked for signs of progress. They review work, ask questions, listen to explanations, and notice when a student needs another approach. What is learning analytics? It adds organized data from learning platforms and other school systems to that process.
A basic report might show which quiz questions a class found difficult. A more advanced system might combine several indicators and alert a teacher when a student’s activity changes. Some systems use artificial intelligence, but a chart or a simple rule can also be learning analytics.
It goes further than a digital gradebook. A gradebook records results. Learning analytics can help someone examine the pattern around those results: which mistakes keep appearing, whether work arrives on time, and whether a student’s progress changes after extra practice.
Its purpose is to help people act. A teacher might revisit a topic. A student might choose what to practise next. A support adviser might check whether something is getting in the way of a student’s work.
What does learning analytics track about students?
The answer depends on the tool and the school. A math practice app, a classroom learning platform, and a university support system will have different records. Schools may also choose which features to use and which sources of information to connect.
| Type of information | What a system may record | What it can help show |
| Assignments | Submitted, missing, or late work; submission dates | Changes in a student’s work pattern |
| Quiz and practice results | Answers, scores, attempts, repeated errors, and hints used | Skills that may need more practice |
| Online course activity | Pages opened, resources accessed, and dates of activity | How a student has used course materials |
| Participation | Discussion posts, comments, or actions in a shared task | Visible contributions to digital activities |
| Attendance | Recorded presence in classes or learning sessions | Attendance patterns, if this source is connected |
| School records | Enrolment details, previous results, and sometimes demographic information | Background information a school has chosen to use |
| Other services | In some institutions, library or student support activity | A broader pattern of interaction with the institution |
Technical logs may also record the time of an action and, in some systems, an IP address. An AI learning tool may retain messages exchanged with its chatbot. These details depend on the service and its settings; they should be explained in its data policy.
A platform’s capability is not proof that a particular school collects every item in this table. Parents and students need information about the tools their own school uses.
Does it know how long a student studied?
Some platforms estimate time spent on an activity or show when a student was active. Those figures need care. A page can remain open while someone does something else. A student can also spend meaningful time learning from a book while the platform is closed.
Page views are useful for seeing whether a resource was accessed and for noticing changes over time. They are a weak measure of attention or understanding.
How does the data become a learning insight?
First, a tool records an event: a student submits an answer, opens a lesson, or misses a deadline. It then organizes events across activities or over time. A dashboard may show the pattern to a teacher or student. In some systems, a rule or predictive model generates an alert.
The resulting information ranges from straightforward to uncertain:
- A record says what happened, such as “the assignment was submitted on Tuesday.”
- A pattern brings records together, such as “three assignments were late this month.”
- An inference suggests what the pattern might mean, such as “this student may need support.”
That final step calls for judgment. A student who repeatedly gets fraction questions wrong may need a different explanation. The questions themselves could also be confusing. Looking at the student’s work and asking how they approached it will tell the teacher more than the score alone.
What does an “at risk” label mean?
It means the student met the conditions a particular system uses to generate that label. Those conditions might involve missed submissions, low course activity, prior results, or a combination of indicators.
When I see an “at risk” label, my first question is: At risk of what, according to which information? One system may use the phrase for likely inactivity in an online course. Another may be estimating the chance of failing a module. Neither label can explain a student’s circumstances or predict their future with certainty.
The appropriate next step is a closer look and, when needed, a supportive conversation.
How can teachers use learning analytics?
Consider a class in which several students keep making the same mistake when comparing fractions. A teacher could inspect their answers, ask students to explain their thinking, and revisit the concept using another example. The report helps draw attention to a pattern; the students’ work helps explain it.
Other useful responses include:
- Giving feedback sooner: A teacher can address a recurring mistake before the next major assessment.
- Adjusting practice: Students can spend more time on a skill they have yet to grasp.
- Checking in: A sudden change in submissions or activity can prompt a conversation.
- Improving a lesson: If much of a class struggles with one task, the teacher can review how it was taught or written.
- Helping students reflect: A clear progress report can help students choose their next step.
These uses work best when the information is understandable, and the response is specific. “Low engagement” is a vague label. “You missed the last two practice tasks; is anything making them difficult to complete?” gives a student something they can answer.
What can learning analytics miss?
A great deal of learning happens outside the system collecting the data. A student might work through a printed worksheet, read with a parent, discuss an idea with a classmate, or receive help from a teacher. Those experiences may leave no trace on a course dashboard.
The system may also show what happened without showing why. Low online activity could reflect limited internet access or a shared device. A late assignment might follow an illness. Quick quiz answers could indicate confidence or guessing.
This matters particularly when data leads to a label. Students should have room to explain their work and correct a mistaken impression. Teachers need to examine the underlying evidence before making decisions that affect support or opportunities.
Learning analytics cannot establish a child’s motivation, diagnose a learning disability, or determine their mental health from ordinary activity records. A student’s thinking and circumstances deserve more attention than a dashboard can give them.
Does learning analytics improve learning?
It can help teachers find useful patterns and respond sooner. The evidence for better learning outcomes, however, depends on the setting and the action taken.
A 2025 analysis combining 34 studies found an overall improvement in learning outcomes from interventions informed by learning analytics. The effects varied by subject, educational stage, and type of support. Research focused on younger students also points to important gaps in what we know about long-term results and the risk of misreading data.
More information does not automatically produce a better response. In two UK university trials, adding a support phone call after an alert did not measurably improve engagement compared with an email alone. Those trials compared two ways of reaching students; they did not test outreach against doing nothing.
The lesson for schools is practical: decide what a dashboard is meant to improve, respond in a way that respects the student, and check whether that response helps.
Who can see student learning data?
Access depends on the school and its tools. A teacher may see work and activity for their class. A support team may see an alert relevant to its role. A student or parent may see a progress view with different details. A technology provider may process information to operate the service.
Schools should be able to explain those arrangements clearly. They should also specify how long records are kept, how they are protected, and whether a student or parent can challenge an inaccurate record or inference.
Privacy rules differ by country. In the United States, FERPA gives parents and eligible students rights concerning education records, subject to the law’s conditions and exceptions. COPPA sets requirements for covered online services collecting personal information from children under 13. In certain school settings, a school can authorize collection for an educational purpose on a parent’s behalf; that does not authorize unrelated commercial uses.
The legal details matter, but families should be able to get a plain answer to a basic question: What does this tool know about this student, and what will the school do with that information?
Let the Data Start a Conversation
A missed assignment, a repeated error, or a sudden drop in activity can give a teacher a reason to look closer. The next step is to examine the work and hear the student’s explanation. That is where a useful response begins.
To me, learning analytics earns its place when it helps someone ask, “What does this student need?” Schools should be able to explain what they track and show how the information leads to support. A dashboard can start that conversation; the people involved must carry it forward.
Frequently asked questions on Learning Analytics
Is learning analytics the same as a gradebook?
No. Grades can be one source of data. Learning analytics may also examine answers, submissions, practice, attendance, and activity patterns to guide feedback or teaching.
Does learning analytics require AI?
No. Simple reports and rules can be learning analytics. Some systems use predictive models or AI to interpret more complex patterns.
Can it predict whether a student will fail?
It can estimate a risk based on selected indicators. The estimate may be wrong, and it cannot account for everything happening in a student’s life. A teacher should use it as a reason to investigate and offer help.
Do all learning analytics tools track students through cameras or microphones?
No. Typical course reports can work from assignments, quiz responses, and activity logs. Any tool that collects recordings or other sensitive information should explain that collection clearly.
Can parents see everything a tool records?
That depends on the platform, the school’s access rules, the student’s age, and applicable law. A parent-facing progress screen may contain less detail than a teacher’s report or a technical log. Families can ask the school what records are available and how to request them.