With gold price record high levels shattering the $4,700 ceiling this week, global markets are signaling a profound shift in risk appetite and currency confidence. This unprecedented rally is not merely a speculative bubble but a structural repricing of real assets amidst persistent inflationary pressures and geopolitical fragmentation. For investors, the critical question shifts from “Why is it rising?” to “Is the momentum sustainable, or is a correction imminent?”
The ascent of gold to $4,700 per troy ounce is not an overnight phenomenon but the culmination of a “perfect storm” of economic divergence that began in the mid-2020s. To understand the gravity of this moment, one must look beyond the daily ticker and analyze the erosion of faith in traditional fiat mechanisms. Following the “Soft Landing” narrative of 2024, the global economy entered a phase of “Sticky Stagflation” in late 2025—where growth slowed, but service-sector inflation remained stubbornly above 4%.
Investors have traditionally viewed gold as a non-yielding asset, making it less attractive when interest rates are high. However, the logic has shifted. With global debt-to-GDP ratios reaching unsustainable levels, the market has begun to price in a potential monetization of debt—essentially betting that central banks will be forced to print money to service liabilities, thereby debasing currencies. This realization has driven institutional capital into the yellow metal, viewing it not just as a hedge, but as a primary store of value in a fractured monetary system.
The Macro-Economic Drivers of the $4,700 Rally

The surge to $4,700 is underpinned by distinct, overlapping economic forces. This is not a single-issue rally; it is a multivariate revaluation of tangible assets.
The Decoupling of Real Rates and Gold
Historically, gold struggles when real interest rates (nominal rates minus inflation) are positive. However, 2026 has defied this axiom. despite the Federal Reserve maintaining rates near 5.5%, gold has continued to climb. This “Great Decoupling” suggests that the market no longer views Treasury bonds as “risk-free” in real terms. Investors are demanding a premium for holding government debt, and when that premium isn’t met, capital flows into commodities. The correlation breakdown indicates a deeper structural fear: that fiscal dominance will prevent central banks from ever crushing inflation completely.
Weaponization of Finance and Dedollarization
The accelerating trend of BRICS+ nations settling trade in non-dollar currencies has reduced the structural demand for the USD. As major energy exporters accept Yuan, Rupees, or Gold-backed digital tokens for oil, the “petrodollar” system’s exclusivity has waned. Central banks in the Global South have actively swapped US Treasury holdings for physical gold. This sovereign buying creates a high “floor” for gold prices; unlike retail investors who may sell during a panic, central banks are strategic, long-term holders who rarely liquidate, effectively removing supply from the market.
Comparative Asset Performance (2024–2026)
| Asset Class | 2024 Return | 2025 Return | 2026 YTD | Primary Driver |
| Physical Gold | +12% | +28% | +18% | Central Bank Buying & Currency Debasement Fears |
| S&P 500 | +21% | +8% | -2% | Earnings Compression & Valuation Concerns |
| US 10-Year Treasury | -4% | +2% | -1.5% | Inflation Persistence & Fiscal Deficit |
| Bitcoin | +55% | -10% | +22% | Institutional Adoption vs. Regulatory Headwinds |
| Real Estate (Comm.) | -8% | -5% | -3% | Refinancing Risks & Remote Work Shifts |
Inflation Dynamics vs. Supply Constraints
While monetary policy drives demand, physical constraints are beginning to squeeze supply. The “easy gold” has already been mined.
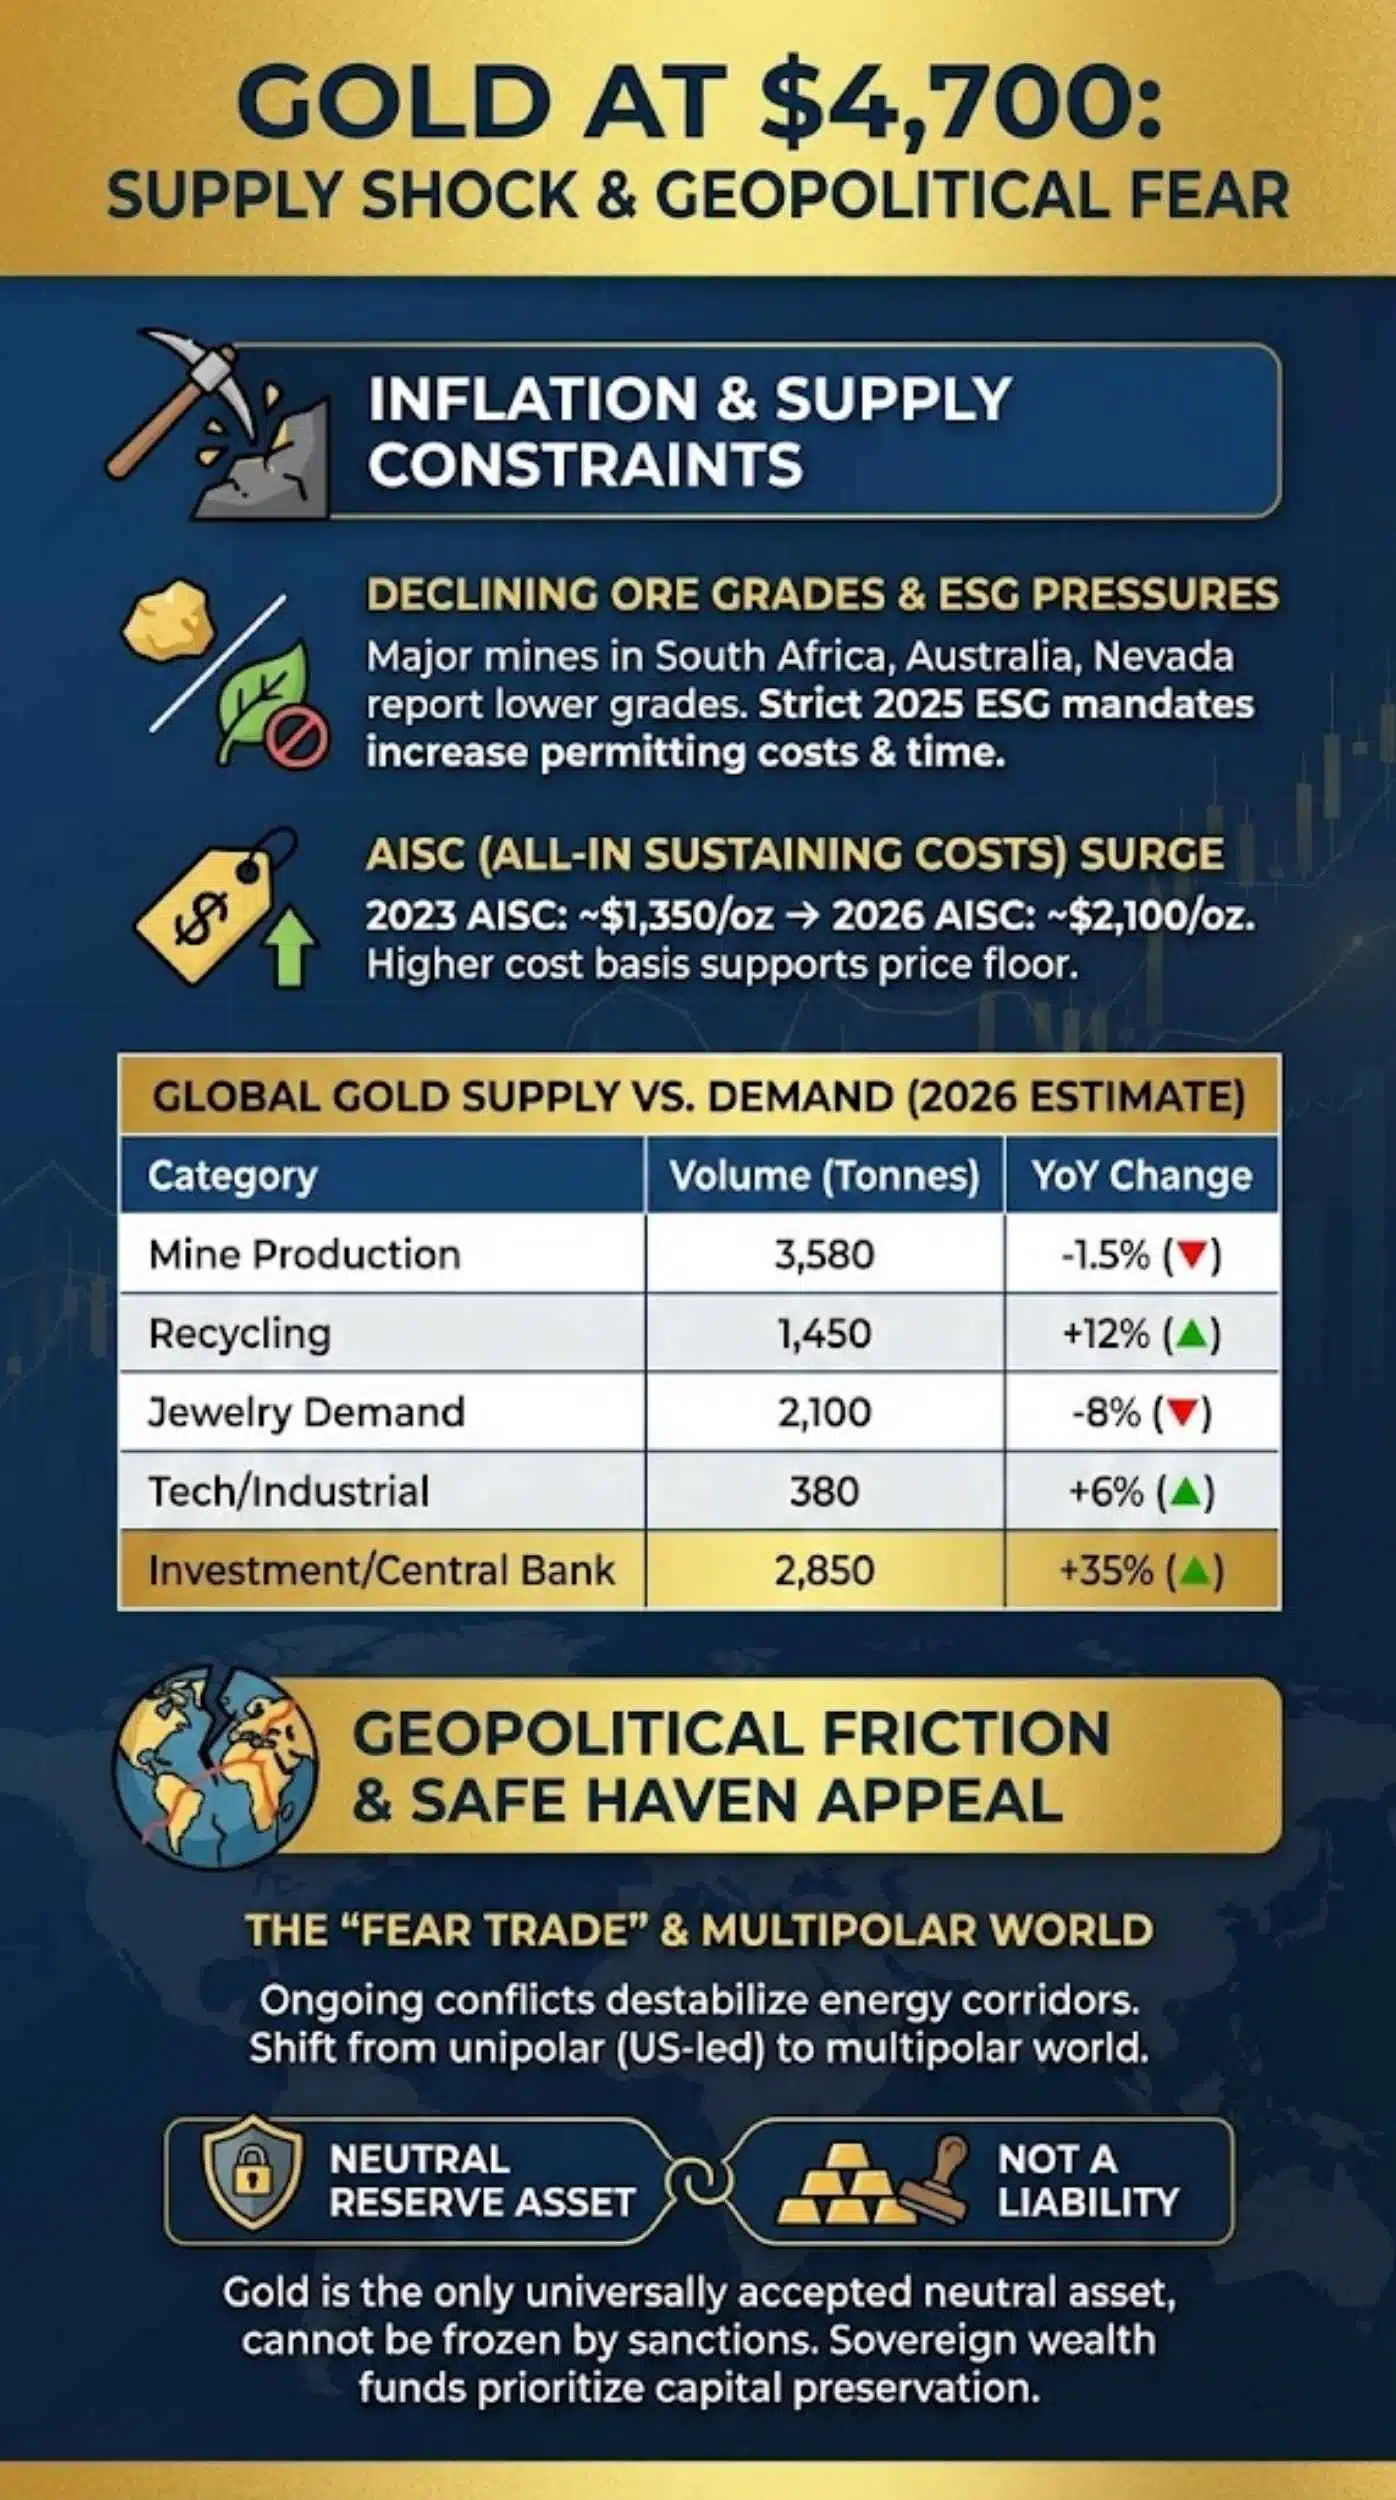
Declining Ore Grades and ESG Pressures
Major mining conglomerates have reported a steady decline in ore grades at primary sites in South Africa, Australia, and Nevada. Furthermore, strict Environmental, Social, and Governance (ESG) mandates enforced in 2025 have made permitting new mines significantly more expensive and time-consuming. We are witnessing a classic supply shock: just as investment demand is peaking due to macro fears, physical output is plateauing.
The cost of production (All-In Sustaining Costs, or AISC) has also risen sharply due to energy prices and labor shortages. In 2023, the AISC for a major miner was roughly $1,350/oz. In 2026, that figure approaches $2,100/oz. This higher cost basis supports a higher price floor; miners simply cannot afford to sell gold cheaply anymore.
Global Gold Supply vs. Demand Dynamics (2026 Estimate)
| Category | Volume (Tonnes) | Year-over-Year Change | Insight |
| Mine Production | 3,580 | -1.5% | Aging mines and lack of new discoveries limiting output. |
| Recycling | 1,450 | +12% | High prices encouraging consumers to sell jewelry. |
| Jewelry Demand | 2,100 | -8% | Price sensitivity impacting retail buyers in India/China. |
| Tech/Industrial | 380 | +6% | Growth in AI hardware/quantum computing demanding high-purity gold. |
| Investment/Central Bank | 2,850 | +35% | The primary engine of the current price surge. |
Geopolitical Friction and the Safe Haven Appeal
The “Fear Trade” accounts for a significant portion of the current valuation. With ongoing regional conflicts destabilizing energy corridors in the Middle East and Eastern Europe, capital preservation has become the dominant strategy for sovereign wealth funds.
In previous decades, geopolitical shocks caused temporary spikes in gold prices that would dissipate once tensions cooled. The difference in 2026 is the permanence of the friction. We are moving from a unipolar world (US-led) to a multipolar one. During such transitions, history shows that gold acts as the only universally accepted neutral reserve asset. It is the only currency that is not someone else’s liability. As alliances shift, nations prefer an asset that cannot be frozen by sanctions.
Investment Scenarios: The Bull vs. Bear Case
Investors sitting on substantial gains or those looking to enter the market at $4,700 face a difficult decision. Is this the peak, or merely a consolidation station on the way to $5,000?
Scenario Analysis for Portfolio Management
| Scenario | Probability | Trigger Events | Gold Price Target | Strategy |
| The “Supercycle” Extension | 45% | Inflation remains >5%; Fed pivots to yield curve control; Geopolitical conflict widens. | $5,200 – $5,500 | Hold/Accumulate. Treat dips as buying opportunities. |
| The “Soft Correction” | 35% | Inflation cools to 3%; Geopolitical tensions ease slightly; Profit-taking by hedge funds. | $4,100 – $4,300 | Rebalance. Trim 10-15% of position to lock in gains. |
| The “Deflationary Bust” | 20% | Global recession triggers liquidity crisis; Massive sell-off in all assets to raise cash. | $3,500 – $3,800 | Sell/Hedge. Move to cash or short-term Treasuries. |
Expert Perspectives: The Street’s View
To provide a balanced view, we analyzed notes from major financial institutions released this week regarding the $4,700 milestone.
The Bullish Argument
Global strategists at major investment firms argue that we are in the early innings of a “Commodity Supercycle.” They point to the debasement of fiat currency as a mathematical certainty given the debt loads of the G7 nations. “Gold is not expensive at $4,700,” notes a lead commodities strategist. “The dollar is simply cheap. When you adjust for the expansion of the M2 money supply since 2020, gold is merely catching up to its fair value. We see $5,000 as a psychological barrier, not a fundamental cap.”
The Bearish Counterpoint
Conversely, technical analysts warn that the Relative Strength Index (RSI) on the monthly chart is at historic highs, signaling an “overbought” condition. “Vertical moves are rarely sustainable without consolidation,” warns a senior portfolio manager at a leading hedge fund. “While the long-term thesis is sound, the market is currently priced for perfection. Any hawkish surprise from the Federal Reserve or a resolution to a major geopolitical conflict could trigger a rapid $500 correction. Investors chasing the price here are vulnerable.”
Future Outlook: What Happens Next?
Looking ahead to the remainder of 2026, the trajectory of gold will likely depend on the “Fiscal Dominance” narrative. If governments continue to run large deficits that require central bank financing, gold will remain bid.
- The $5,000 Psychological Barrier: Expect significant volatility as prices approach $5,000. Algorithmic trading bots are likely programmed to sell at this level, creating a temporary ceiling.
- Digital Gold vs. Physical Gold: The interplay between Bitcoin and Gold will intensify. As Bitcoin matures, it may capture some of the speculative flows that traditionally went to gold, but for sovereign states, physical gold will remain the premier reserve asset.
- Monetary Reset Speculation: Fringe economic theories about a “return to a gold standard” or a gold-backed trade currency (from the BRICS bloc) will move from conspiracy to mainstream debate, adding a speculative premium to the price.
Final Thoughts
Gold at $4,700 is a wake-up call regarding the health of the global fiat monetary system. While the price may seem high relative to historical norms, it is a rational response to an era of high debt, geopolitical instability, and sticky inflation. For the individual investor, the time to “go all in” has passed, but the time to exit entirely has not arrived. The prudent move is to maintain a diversified exposure, rebalancing the portfolio to ensure that gold represents a healthy insurance policy—perhaps 5-10% of net worth—rather than a speculative wager.