Many freight firms hit a wall when they try to track scope 3 emissions in their supply chain. Data shows that indirect CO2 makes up most of a trucking firm’s total footprint. This post shows five carbon accounting software tools, like Watershed and Emitwise, that help firms spot, measure, and cut emissions.
Keep reading.
Key Takeaways
- Watershed maps scope 1–3 emissions in minutes, links Microsoft Sustainability Cloud and IBM Environmental Intelligence Suite, and raised $100 million for new features.
- Persefoni tracks scope 1–3 emissions with AI-powered audit trails for fuel bills and mileage logs, and it saw 150% user growth.
- SpheraCloud offers live charts for scope 1–3 emissions, stores UN and WRI emission factors, runs what-if models, and meets EU and CDP report needs.
- Emitwise links IoT sensors and API feeds to track real-time scope 1–3 emissions, updates dashboards every minute, and cuts reporting time by 65%.
- Normative uses WRI data and AI to map scope 1–3 emissions, feeds CSRD and TCFD templates, and benchmarks against 5,000+ firms.
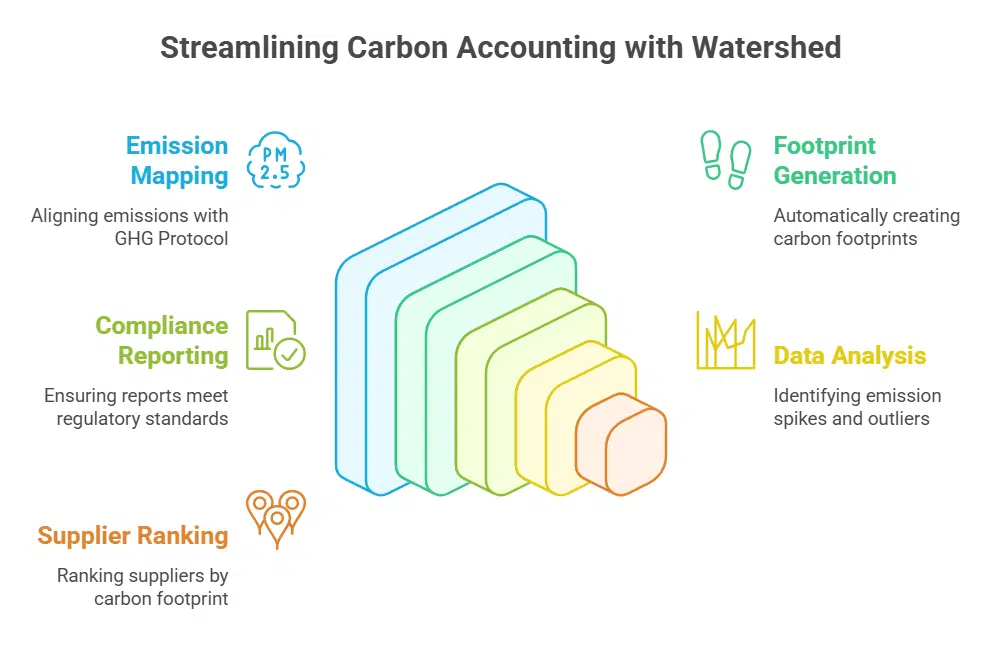
Watershed: A Comprehensive Carbon Management Platform
Watershed pulls data from delivery vans, distribution centers, and suppliers to map Scope 1, 2, and 3 emissions in minutes. It links greenhouse gas protocol rules with performance cards and Microsoft Sustainability Cloud so teams catch trends and set net zero targets fast.
What features does Watershed offer for logistics companies?
Logistics teams need clear, fast carbon data. This platform connects real time emissions with supply chain systems.
- Users can track scope 1, scope 2, and scope 3 emissions across trucks, ships, and air freight so they see carbon footprint by mode.
- The platform connects supply chain emissions data from Azure, Amazon Web Services, and on premise systems through APIs, boosting accuracy and saving hours of manual work.
- Carbon accounting software uses the greenhouse gas protocol to auto generate CSRD and TCFD reports, cutting report time from weeks to hours.
- Dashboards show real time carbon intensity on interactive maps, so teams spot high impact routes and cut emissions fast.
- Managers get trend lines, supplier breakouts, and hotspot alerts in one view for quick decisions on carbon accounting and sustainability reporting.
- A collaboration space lets drivers, carriers, and suppliers share goals, tasks, and updates, improving performance and carbon reduction.
- Every data point gets a time stamped audit trail, helping logistics firms pass regulatory compliance checks and greenhouse gas audits.
- The system links to Microsoft Sustainability Cloud and IBM Environmental Intelligence Suite, making integration with carbon management platforms simple.
How does Watershed simplify carbon accounting?
Watershed syncs data across spreadsheets, ERP systems, and telematics feeds in its carbon accounting software. It maps scope 1 emissions, scope 2 emissions, and scope 3 emissions to the GHG Protocol.
Logistics teams link fuel burn, electricity use, and transport logs in minutes. Teams auto generate carbon footprints to speed audits and cut errors. Reports comply with CSRD and SEC climate risk rules.
The platform raised $100 million for new features.
It taps APIs from Microsoft Sustainability Cloud, IBM Environmental Intelligence Suite, and Sinai Technologies. That links transport data to live dashboards. Teams spot emission spikes in trucks and warehouses.
Platform uses AI to catch data gaps and flag outliers in greenhouse gas emissions. Users rank suppliers by carbon footprint and cost. This carbon management platform keeps audits lean and swift.
Persefoni: Streamlined Emissions Tracking and Reporting
Persefoni tracks scope 3 emissions for shippers, so they spot greenhouse gas rises fast. It links into CSRD reports, letting carriers shape clear climate action plans.
How does Persefoni track emissions for logistics?
Operators load fuel bills, mileage logs, and carrier invoices into Persefoni’s dashboard. The AI-powered audit trail scans each record, spots missing details, and alerts teams to odd readings.
It ends spreadsheet nightmares. Users link transportation data to reports and track carbon emissions across truck routes and freight lanes.
Reporting covers Scope 1 from owned fleets, Scope 2 from electric hubs, and Scope 3 from subcontracted carriers. The platform applies emission factors, runs data analytics for greenhouse gas accounting, and calculates CO2 equivalents per mile.
Teams watch trends on a live dashboard, adjust plans, and drive climate action in logistics.
What reporting capabilities does Persefoni provide?
Persefoni serves up ready-to-share, framework-aligned reports. The platform hit 150% user growth after it added audit trails powered by AI.
- TCFD, the task force on climate-related financial disclosures, exports that walk readers through climate risk analytics and breakdown of greenhouse gas emissions by type. It maps carbon dioxide, methane, nitrous oxide, and sulfur hexafluoride.
- CSRD, the corporate sustainability reporting directive, templates that match SASB rules and guide logistics firms on scope 1, scope 2, and scope 3 emissions. They clarify supply chain emissions and support regulatory compliance.
- Interactive dashboards that show carbon footprint trends in simple charts. They link data to Microsoft Sustainability Cloud and Sinai Technologies for wide data sources.
- Automated sections that feed numbers into IBM Environmental Intelligence Suite. They speed up sustainability reporting and cut down admin time for climate goals.
- AI-powered audit trails that log each update for clear history. They reduce risk of non-compliance and boost carbon accounting accuracy.
- Quick export features that output PDF or Excel versions in minutes. They help with emission reduction plans and support environmental, social, and governance reports.
SpheraCloud: Advanced Analytics for Carbon Footprint Monitoring
SpheraCloud turns raw data into clear dashboards, helping you spot scope 3 emissions, from idle trucks to warehouse lights. It taps into a big cloud service and a global guideline group, and it shows greenhouse gases like CO₂ and N₂O in simple charts, like X-ray specs for your carbon trail.
What analytics tools are available in SpheraCloud?
SpheraCloud packs sharp analytics, giving clear carbon footprint insights. They help logistics firms track ghg emissions, energy consumption, and supply chain emissions.
- Interactive dashboards display live charts on greenhouse gas emissions, scope 1, scope 2, scope 3. They merge emission inventory management data into easy visuals.
- Emission factor library stores data from United Nations climate panel, World Resources Institute, and national agencies. It supports carbon dioxide equivalent, co2, methane, and n2o metrics.
- Real-time data connector links to smart meters on trucks and warehouses. It feeds energy consumption and fuel use metrics automatically.
- Scenario modeling engine runs what-if cases on carbon pricing, carbon offset projects, and mitigation plans. It projects carbon reductions under different fuel mixes.
- Regulatory reporting module auto-generates EU sustainability directive, Task Force guidelines, and Carbon Disclosure Project templates. It smooths regulatory compliance and sustainability reporting workflows.
- Climate risk analytics tool maps hazard data onto supply chains, highlighting risk management hotspots. It guides resilience planning for climate risk scenarios.
- Inventory tracker manages sites, fleets, and scope 3 provider data. It ties to sustainability reporting workflows and emission inventory management.
How can logistics companies use SpheraCloud to monitor their footprint?
Logistics teams open the SpheraCloud dashboard to view real time co2 emissions. The app shows scope 1, scope 2 and scope 3 emissions for each trip. Users upload fuel data and track greenhouse gas emissions per mile.
Carbon accounting software flags hotspots so you curb waste fast.
This platform suits heavy industries, including logistics firms, freight and ports. It provides tools for emission inventories, regulatory compliance and monitoring under csrd rules.
Charts break down supply chain emissions by route and date. Teams view carbon footprint hot spots on a map. You export data for sustainability reporting and spot green wins on every lane.
Emitwise: Real-Time Carbon Tracking for Logistics Operations
Emitwise taps IoT sensors and API feeds to track real-time scope 3 emissions. It acts like a carbon copilot for your logistics crew, nudging you to cut fuel use and curb your footprint with every mile.
How does Emitwise enable real-time carbon tracking?
Users link sensors and data feeds to Emitwise. It pulls data across fleets and supply chain emissions in real time, like a carbon meter on your fleet’s dashboard. This tracks Scope 3 emissions live so teams spot carbon spikes at once.
The platform cuts reporting time by 65 percent by automating carbon accounting software tasks. It taps a top cloud platform and an advanced analytics suite for solid data management.
Dashboards update every minute. They show greenhouse gas emissions by route, vehicle, and fuel. Users adjust routes or swap to low-carbon fuels on the fly. AI-driven climate risk analytics help forecast global warming potential.
This live stream helps logistics firms meet regulatory compliance and boost sustainability reporting.
What benefits does Emitwise bring to logistics operations?
Logistics teams spot greenhouse gas output like a hawk on live carbon charts. They track scope 1, scope 2, and scope 3 emissions on one screen. Dashboards update instantly, so waste shows up fast.
This speed cuts reporting time by 65% and helps fight climate change.
It plugs into IBM Environmental Intelligence Suite and Microsoft Sustainability Cloud for smooth data flow. Sensors and automation feed carbon accounting engines, so staff skip manual entry.
Drivers hit carbon targets and meet CSRD rules with ease. Companies polish their reputation while moving goods.
Normative: Data-Driven Insights for Sustainability Goals
Normative uses artificial intelligence and World Resources Institute data to shine a light on scope 3 emissions in your supply chain. It maps results to CSRD, TCFD, and the EU taxonomy so you can chart a clear course to carbon neutrality.
How does Normative generate insights for sustainability?
Teams use Normative to upload fuel bills, freight logs, and energy invoices into a free carbon reporting calculator backed by the United Nations. The tool maps direct greenhouse gas emissions, purchased energy, and supply chain emissions across trucking, air freight, and warehousing.
It pulls emission factors from a global nonprofit for combustion and methane, then uses AI from Microsoft Sustainability Cloud and an enterprise climate analytics platform to flag trends.
This platform feeds dynamic charts, heat maps, and monthly dashboards so teams set sustainability goals, track climate crisis metrics, and meet CSRD or TCFD requirements. Managers compare routes by carbon footprint, test low-carbon fuels, and explore carbon neutrality paths.
Regulatory compliance becomes easier and external audits run smoother.
In what ways can logistics companies leverage Normative’s data?
Logistics firms tap Normative data to map supply chain emissions and spot hot spots. The platform tracks scope 1 emissions, scope 2 emissions, and scope 3 emissions in one view. Data streams in from freight bookings and fuel invoices via an API.
That feeds platforms like IBM Environmental Intelligence Suite or Microsoft Sustainability Cloud. Guesswork vanishes and actual carbon footprint numbers and costs appear.
Normative uses data from over 5,000 firms to set practical benchmarks, and it feels like a co-pilot on a long haul. The dashboard ranks carriers by carbon intensity and flags routes with high methane leaks.
It helps meet CSRD and TCFD rules, and speeds up sustainability reporting. Fuel buys become smarter and route plans improve. Time savings add up, and emissions shrink.
Key Features to Look for in Carbon Accounting Tools

A good tool turns scope 3 emissions into clear charts, so your team can read them fast. You can sync data with Microsoft Sustainability Cloud or an enterprise software system, and nail your CSRD reports in record time.
What are the essential features logistics companies need?
Every logistics team needs a clear view of their emissions. They need tools that tie data to standards and keep audit teams happy.
- Track scope 1, 2, and 3 emissions in one place, so you never miss supply chain emissions.
- Offer real time data integration with IoT feeds, ERP systems, and Sinai’s tracking engine.
- Map supply chain emissions across all legs, to spot hotspots and trim your carbon footprint.
- Align reports with the GHG Protocol, CSRD, and TCFD, to meet regulatory compliance with ease.
- Deliver audit ready export files, so accountants can check every number.
- Show climate risk analytics, so you can plan for storms or fuel price hikes.
- Include user friendly dashboards, so busy managers don’t scratch their heads.
- Enable API connections to Microsoft’s environmental dashboard and IBM’s climate intelligence platform.
- Automate workflows for sustainability reporting, to speed up CSRD disclosures.
- Model carbon sequestration scenarios, to show how tree planting or offsets can shrink your greenhouse gas emissions.
How do these features improve carbon accounting accuracy?
The analytics hub merges data from IoT sensors, fuel logs, and ERP systems. It flags errors in supply chain emissions and scope 3 emissions. It ties each entry to an audit trail, so teams see the full history.
This method boosts carbon footprint measures and meets regulatory compliance.
The tracking platform shows real time dashboards and climate risk analytics. It checks figures against the GHG Protocol and CSRD standards. It keeps logs for audit readiness and proof of accuracy.
Teams trust these reports for sustainability reporting.
Benefits of Implementing Carbon Accounting in Logistics
Teams slash costs and waste when they map logistics emissions across all routes. They spot downstream greenhouse gas gaps and shrink their carbon footprint with real-time data from Emitwise.
What are the main advantages of carbon accounting?
Carbon accounting reveals greenhouse gas emissions from trucks, warehouses, and supply chain emissions. Logistics teams track scope 1 emissions, scope 2 emissions, and scope 3 emissions.
A cloud platform collects carbon data in real time. Software simplifies reporting under CSRD and TCFD rules. The process cuts fuel waste and lowers costs.
Many companies tap climate risk analytics to spot problem areas. They boost regulatory compliance and move toward sustainability goals. Tracking helps shrink fossil fuel use and methane (CH4) output.
A research group provides standards and data. Firms can show transparency in sustainability reporting and build trust with stakeholders.
How does carbon accounting support logistics sustainability?
Good carbon accounting logs scope 1, scope 2, and scope 3 emissions in fleets, ports, and warehouses. It lets teams buy emission permits and back reforestation schemes. This data feeds real time dashboards, supports sustainability reporting, and meets CSRD rules.
Companies see supply chain emissions hot spots and cut fuel use fast.
That tool also drives talent search and stakeholder engagement, since green goals attract top staff. It adds climate risk analytics for smarter risk management, and stays compliant with TCFD and other rules.
Teams track greenhouse gas emissions in one user-friendly hub, and hit corporate sustainability goals.
Takeaways
Carriers gain clear insight on carbon footprint with these five platforms. Watershed grabs data on scope 3 emissions. Persefoni logs scope 1 and scope 2 emissions fast. SpheraCloud powers climate risk analytics for fleets.
Emitwise tracks greenhouse gas emissions in real time. Normative maps supply chain emissions in minutes. Smart carbon accounting meets regulatory compliance and boosts sustainability reporting.
Each choice drives better environmental goals.
FAQs on Carbon Accounting Tools for Logistics Companies
1. What is carbon accounting software for logistics firms?
Carbon accounting software tracks greenhouse gas emissions, from fuel use to deforestation. It shows your carbon footprint across scope 1, scope 2, and scope 3 emissions. You can pick Microsoft Sustainability Cloud, IBM Environmental Intelligence Suite, Sinai Technologies, a climate risk analytics platform, or the WRI GHG Protocol tool.
2. How do these tools measure scope 1, scope 2, and scope 3 emissions?
They pull data from fuel logs, energy bills, and supplier reports. They split that data into the three emissions scopes. They shine a light on hidden leaks. They run climate risk analytics for smart risk management. You see your impact on the environment and the atmosphere.
3. Which tool helps cut supply chain emissions and meet compliance?
Sinai Technologies nails supply chain emissions and scope 3 emissions. It aligns with World Resources Institute (WRI) standards. You get clear data on fossil fuels and deforestation. You can also lean on Microsoft Sustainability Cloud or IBM Environmental Intelligence Suite for CSRD and TCFD steps.
4. Which tools support sustainability reporting and regulatory compliance?
Microsoft Sustainability Cloud and IBM Environmental Intelligence Suite cover CSRD, TCFD, and other rules. They build your sustainability reporting with real numbers on greenhouse gas (ghg) emissions. They help you hit your sustainability goals and stay on the right side of regulators.
5. How can these tools help reach my sustainability goals?
They point out fuel waste, including in manufacturing and transport. They map scope 1, scope 2, and scope 3 gaps. They call out risks from fossil fuels and deforestation. You cut costs without breaking a sweat. And you lower your impact on the environment.