
Red Sea shipping costs are spiking again at a moment when diplomacy is trying to prevent a wider regional fire from spreading. This matters now because freight, insurance, and detour time are turning a security problem into a measurable global tax on trade, and that tax hits inflation, energy flows, and political stability all at once.
The Red Sea Premium: Why Shipping Costs Spike So Fast?
The Red Sea is not just a stretch of water between Africa and the Arabian Peninsula. It is a global pricing corridor because it connects the Bab el-Mandeb chokepoint to the Suez Canal, the shortest high-volume route between Asia and Europe. When threat levels rise, the market does not wait for a full shutdown. It prices the probability of disruption, and that probability shows up immediately in freight rates, war-risk insurance, and vessel availability.
There is a simple reason the price reaction can look outsized compared to the number of incidents. Modern liner shipping is built around tight schedules and high utilization. When ships divert around the Cape of Good Hope, the trip gets longer by days and sometimes weeks depending on the service string and port rotation. A longer voyage does not only burn more fuel. It also traps the ship in transit for longer, which reduces how many round trips that vessel can complete in a month or quarter. Even if global demand stays flat, “effective capacity” falls, and spot rates jump.
This is why shipping shocks often feel nonlinear. A modest change in route choice can create a large change in available capacity on the lanes that matter. Carriers then respond by reallocating vessels, blanking sailings, and tightening space. Shippers respond by front-loading orders, paying premiums for reliability, and shifting from contract to spot when they fear delays. Each of those moves is rational on its own. Together, they create the kind of cost spike that looks sudden to consumers but predictable to anyone watching vessel routing data and insurance markets.
Insurance is the second accelerant. War-risk premiums can double quickly when insurers reassess risk after new attacks, even if the total number of transits remains large. Insurance pricing is not only about what happened, it is also about what might happen next and how confident insurers are that the risk can be contained. When coverage becomes more expensive or less available, it forces shipowners and charterers to make defensive choices, which further tightens capacity and pushes up rates.
What makes 2026 especially sensitive is that supply chains are still in a “post-fragility” era. Many firms rebuilt buffers after earlier disruptions, but they did not rebuild infinite buffers. They also learned that a single chokepoint can shift costs across an entire network. That learning has changed behavior in procurement, inventory policy, and even financing. In plain terms, companies have become quicker to pay more now to avoid paying much more later.
Here is what the price signal looks like in early January 2026 using widely tracked spot indicators. These numbers are useful not because they are perfect, but because they reflect what buyers are paying right now for space on key lanes.
| Spot Indicator Snapshot (Early Jan 2026) | Level | Short-Term Move | What It Suggests |
| Global composite container index (40ft) | 2,557 | Up 16% | Broad rebound in spot prices |
| Shanghai to Genoa (40ft) | 3,885 | Up 13% | Asia to Med pressured by Red Sea risk |
| Shanghai to Rotterdam (40ft) | 2,840 | Up 10% | Asia to North Europe tightening |
| Shanghai to Los Angeles (40ft) | 3,132 | Up 26% | Knock-on repricing beyond Europe lanes |
| Shanghai to New York (40ft) | 3,957 | Up 20% | Network ripple effect and repositioning |
A key point is that prices can rise even when demand is not booming. Shipping is a network business, so disruptions push costs into routes that are not directly threatened. If Europe-bound services detour, vessels and boxes are out of position. If carriers prioritize schedule recovery, they may reduce port calls or stretch rotations. If importers fear delays, they ship earlier and create a short burst of demand. These second-order effects are why a Red Sea shock can show up on transpacific rates, warehousing markets, and even trucking capacity.
It is also important to separate two forces that often get conflated. One is genuine risk cost, which comes from longer routes, more fuel, insurance premiums, and slower turnarounds. The other is market power, which comes from how carriers manage capacity and pricing. In 2026, both forces are in play, and that is why the cost spike can persist longer than a headline cycle.
Diplomacy Meets Maritime Deterrence: Why The Political Calendar Matters To Freight?
The topic framing of “Blinken returns” captures a broader truth even beyond one individual. The diplomacy model that dominated the Gaza war era was shuttle-based and deadline-driven, built around preventing spillover while trying to achieve limited agreements. That model becomes even more urgent when the economic spillover becomes visible in shipping prices, food costs, and state revenues.
Maritime security is a hard domain for deterrence because the cost exchange favors the disruptor. A relatively low-cost threat can force a high-cost reroute. Even when defensive forces intercept many attacks, the residual risk can remain large enough that insurers and carriers price it aggressively. This is not a failure of navies. It is the structural reality that commercial shipping relies on confidence, and confidence is fragile when threats are persistent and adaptable.
That is why diplomatic moves and security moves interact. A ceasefire negotiation on land can reduce the motivation for maritime attacks. A de-escalation channel between regional powers can reduce the flow of weapons or intelligence that enables attacks. A credible enforcement campaign can lower the perceived risk for insurers. But none of these levers works instantly. Markets often move faster than diplomacy, and that timing gap is where the real economic damage can accumulate.
Europe’s posture in the Red Sea in recent years illustrates how quickly “shipping protection” becomes strategic policy. Defensive maritime missions are not just about escorts. They become about intelligence sharing, surveillance, sanctions enforcement, and broader deterrence messaging. For commercial actors, the main question is not whether a mission exists. The question is whether the mission changes the probability distribution of loss enough to justify resuming the shorter route through the Red Sea and Suez.
The United States, Europe, and regional partners also face a coordination challenge. Shipping is global, but rules of engagement and political objectives are national. When a coalition is defensive, it can reduce risk but not eliminate it. When it becomes more offensive, it can change incentives but also risk escalation. These tradeoffs matter because the shipping market reacts to perceived escalation risk as much as it reacts to immediate attacks.
The other factor that makes diplomacy central is that the Red Sea shock is not only a commercial problem. It is a sovereignty and revenue problem for key states, especially Egypt. When toll revenue drops, foreign currency inflows drop, budget pressures rise, and political stability becomes more sensitive to external shocks. That turns maritime security into domestic politics.
In that sense, diplomacy is not separate from shipping. It is a cost-control mechanism for the global economy. When envoys return to the region, the quiet agenda includes restoring predictability for trade corridors. The reason you see repeated high-level engagement is that the alternative is a world where every month of uncertainty acts like an inflation pulse.
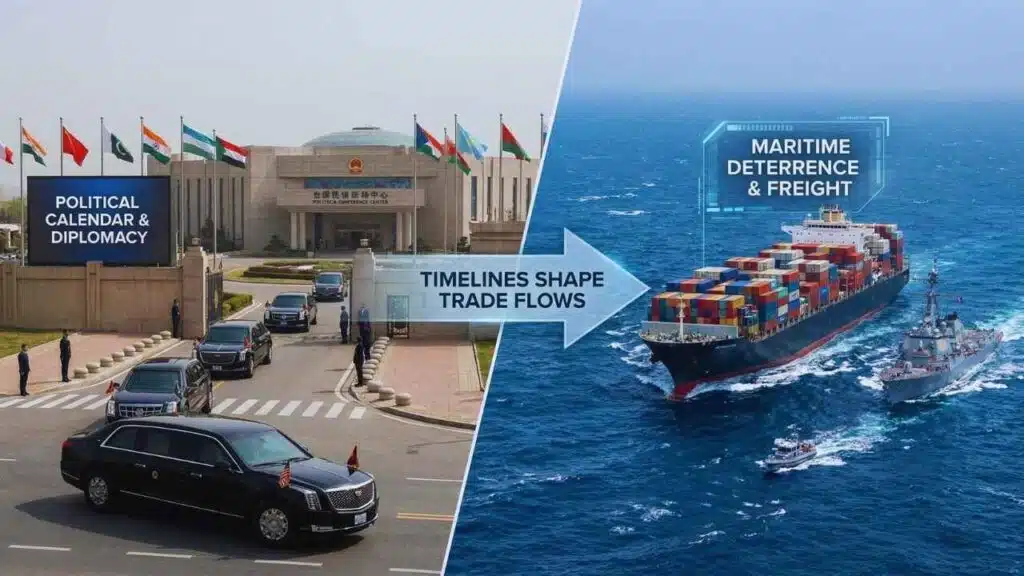
One more point often missed in day-to-day reporting is that diplomatic timelines shape corporate timelines. If shippers believe there is a realistic chance of de-escalation in the next one to two months, they may tolerate higher costs temporarily and avoid overreacting with inventory hoarding. If they believe uncertainty will persist for a year, they build new routing plans, renegotiate contracts, and redesign supply chains. In other words, diplomacy influences whether the shock is temporary or structural.
Regional Balance Sheets: Who Absorbs The Costs And How It Changes Behavior?
The Red Sea crisis is frequently described as a global supply chain story, but it is also a regional fiscal story. Some states lose revenue directly. Others gain leverage indirectly. Some face security risks that spill into domestic politics. The economic map of winners and losers shapes how each actor approaches escalation and de-escalation.
Egypt is the clearest example of direct exposure because the Suez Canal is a major source of foreign currency and state revenue. When vessels detour around Africa, they do not pay canal tolls, and they also do not purchase associated services. That loss is not theoretical. Egypt has publicly referenced monthly losses on the order of hundreds of millions of dollars, and the decline in annual canal revenue in 2024 was dramatic compared to the record year before. This matters because Egypt’s ability to stabilize its currency, manage debt service, and fund domestic priorities is tied to predictable hard-currency inflows.
When a state faces that kind of repeated loss, it typically explores three policy responses. The first is security diplomacy, pushing for de-escalation and for partners to reduce threats. The second is commercial incentives, such as discounts or temporary pricing changes to lure traffic back. The third is financial support, whether from allies, lenders, or multilaterals. Each path has political costs, but the canal revenue decline increases the urgency to choose something.
The Gulf states experience the crisis differently. They are not dependent on Suez toll revenue, but they are exposed through energy flows, insurance costs, and reputational risk. When freight and insurance rise, it affects import costs and industrial supply chains. When regional conflict threatens to widen, it affects investment and tourism. Gulf governments also sit at the center of many diplomatic channels, which can increase their leverage and responsibility. In practice, the Gulf’s role becomes part mediator, part financier of stabilization, and part risk manager for global energy markets.
Israel’s relationship to the Red Sea shock is political and strategic rather than purely commercial. Even when targeting is framed around certain flags or destinations, the perception of association can raise risk premiums for the entire corridor. That makes the maritime theater a form of strategic signaling, which then loops back into negotiations on land. For Israel and its partners, maritime security becomes another dimension of deterrence and another reason to seek outcomes that reduce the incentives for continued attacks.
Yemen is the operational center of the maritime threat environment, but it is also a humanitarian and political tragedy that makes simple solutions hard. The longer the conflict dynamics remain unresolved, the more likely it is that maritime threats remain a tool of leverage. That is why a purely naval solution tends to be incomplete. Maritime defense can reduce damage, but it rarely resolves the political drivers that produce repeated attacks.
Europe is a major downstream stakeholder because Asia to Europe trade is particularly sensitive to Suez routing. European manufacturers and retailers rely on predictable transit times and costs, especially for high-turnover goods. When the Red Sea is risky, Europe imports a kind of hidden inflation. Even if consumer prices do not jump instantly, the cost pressure accumulates in procurement budgets, and firms respond by changing pricing, assortment, and inventory.
There are also countries in East Africa and Southern Africa that can see indirect gains from rerouting. Longer voyages increase the demand for bunkering, provisioning, and port services along alternative routes. That does not compensate for global losses, but it does redistribute some revenue and activity. Over time, those incremental shifts can influence investment in port infrastructure, logistics corridors, and regional trade hubs.
This redistribution can be summarized simply, without pretending it is permanent. The pattern depends on whether ships continue to avoid the Red Sea, and for how long.
| Likely Beneficiaries | Why They Gain In A Detour World | Likely Losers | Why They Lose In A Detour World |
| Ports and service providers on the Cape route | More refueling and services on longer voyages | Egypt’s canal-linked economy | Lost tolls and foreign currency inflows |
| Carriers with strong pricing control | Ability to raise spot and surcharge levels | Low-margin importers and SMEs | Less ability to absorb or pass through costs |
| War-risk insurers and security contractors | Higher premiums and demand for risk services | Time-sensitive supply chains | Greater delay risk and inventory costs |
| Some African logistics nodes | Increased calls and related activity | Humanitarian logistics | Higher risk and higher delivery costs |
A subtle but critical implication is that repeated shocks can change regional bargaining positions. If Egypt’s fiscal pressure rises, it may push harder for diplomatic outcomes or commercial incentives. If the Gulf sees rising risk to energy corridors, it may intensify de-escalation efforts. If Europe sees sustained cost pressure, it may increase its security role or pressure for political solutions. In this way, the shipping crisis becomes a force multiplier in regional politics.
Global Supply Chains And Inflation: Why 2026 Feels Different From Past Shocks?
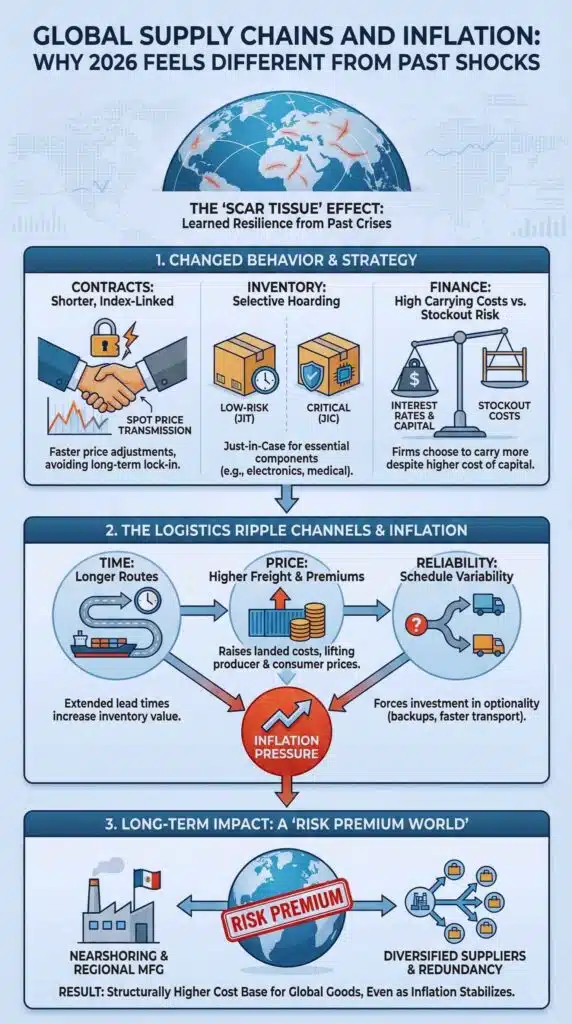
A Red Sea shock can look like a rerun of earlier supply chain crises, but 2026 has distinct features that change the inflation and growth implications. The most important is that businesses and policymakers now have scar tissue. They have already lived through pandemic-era disruptions, post-pandemic port congestion, and earlier rounds of geopolitical shocks. That experience changes how quickly they react and what they are willing to pay for resilience.
One change is contract behavior. Many shippers learned that locking in long-term contracts at the wrong moment can be painful. When volatility rises, some firms prefer shorter contracts or index-linked arrangements. That can accelerate price transmission because spot moves influence contract pricing faster.
Another change is inventory strategy. Just-in-time did not die, but it became more selective. Companies increasingly run “just-in-time” for low-risk items and “just-in-case” for critical components. This creates a world where shocks trigger targeted hoarding rather than broad hoarding. The targeted nature reduces waste, but it can still create intense pressure in specific categories such as electronics components, automotive inputs, or medical supplies.
A third change is finance. Higher interest rates in many economies make inventory more expensive to hold, but they also make disruption more expensive to endure. Firms face a tradeoff between carrying costs and stockout costs. When lead times become uncertain, many choose to carry more inventory despite the financing burden. That adds to inflation pressure indirectly by increasing working capital needs and tightening cash for smaller firms.
For consumers, the link from freight to retail prices is real but not mechanical. It depends on timing, demand conditions, and retailer margins. If demand is weak, retailers may absorb some costs. If demand is strong, they pass through more. If shipping costs spike during key purchasing seasons, the pass-through can be faster. In 2026, the risk is that repeated spikes prevent the system from returning to a calm baseline, even if each spike alone is manageable.
Energy markets add another layer. While container shipping is the headline, energy shipping and insurance costs can move quickly when regional tensions rise. If tanker availability tightens due to longer voyages or risk avoidance, freight rates rise, and that can influence delivered energy prices. Even if crude prices remain stable, freight can add volatility for import-dependent economies.
The logistics ripple can be described through three channels that often operate simultaneously:
- Time: Longer routes extend lead times, which increases the value of inventory and the cost of delays.
- Price: Higher freight and premiums raise landed costs, which can lift producer prices and eventually consumer prices.
- Reliability: Schedule variability forces firms to buy optionality, such as faster transport, backup suppliers, or extra stock.
The global picture also depends on whether normalization returns. If carriers broadly return to Red Sea routing, effective capacity increases and rates can fall sharply. That would reduce inflation pressure, but it can also create operational turbulence as networks reset. If normalization remains partial, the system stays in a high-variance state where prices swing on each incident.
This is where a key distinction matters. A temporary shock is painful but bounded. A persistent “risk premium world” is different because it changes investment decisions. When firms believe chokepoint disruptions are now a recurring feature of trade, they invest in redundancy. They diversify suppliers, add regional manufacturing, and redesign distribution. Those investments can improve resilience over time, but they also raise costs in the short run. That means a persistent Red Sea premium can contribute to a structurally higher cost base for global goods, even if inflation rates eventually stabilize.
To ground the discussion, here is a compact set of metrics that companies, investors, and policymakers tend to watch during periods like this. It mixes shipping indicators with state revenue signals and insurance signals because all three influence behavior.
- Global spot container index level and weekly direction.
- Asia to Europe spot rates, especially into Mediterranean and North Europe.
- War-risk premium changes and availability of coverage.
- Reported Suez transit volumes and revenue trends.
- Carrier announcements on routing and service suspensions.
- Port congestion and container availability in key hubs.
And here is a straightforward “before versus disruption” comparison that captures why the shock feels larger than the headline event.
| Corridor Choice | Typical Advantage | Typical Cost Profile | During High Risk | Resulting Market Effect |
| Red Sea and Suez | Shorter distance and time | Lower fuel and faster turns | Higher risk premium and threat exposure | Some carriers avoid, insurers reprice |
| Cape of Good Hope detour | Avoids the risk zone | Longer distance and slower turns | Higher fuel, longer lead time | Effective capacity falls, rates rise |
| Mixed routing and selective transits | Flexibility | Operational complexity | Used as a hedge | High volatility, uneven pricing |
In practical terms, the main global question for 2026 is whether the Red Sea premium becomes an on-and-off surcharge or a semi-permanent feature that alters trade geography. The answer depends on security conditions, diplomacy, and how quickly commercial confidence can be rebuilt.
What Happens Next: Scenarios, Milestones, And Practical Signals To Watch?
Forecasting geopolitics is risky, so it is better to present scenarios with clear triggers. The shipping market is already doing this implicitly through pricing and routing. The goal here is to make the logic explicit so readers can evaluate what is happening week by week.
Scenario A: Gradual Normalization With Periodic Spikes
In this path, security conditions improve enough that more carriers test Red Sea transits, but not enough to create a full return to pre-crisis confidence. Attacks become less frequent or less effective, but the residual risk remains high enough that insurers keep premiums elevated. Freight rates ease compared to peak crisis moments, yet remain volatile.
This is arguably the most realistic near-term outcome because commercial decision-makers prefer incremental change. A single successful transit does not prove the corridor is safe. Carriers will look for consistent patterns. Insurers will look for sustained risk reduction. Ports and supply chains will look for reliability.
Signals to watch: more frequent announced transits, gradual reduction in war-risk premiums, and increasing canal traffic without a sharp drop in spot rates.
Scenario B: Fast De-Escalation And A Sharp Rate Reset
In this path, diplomacy produces a meaningful de-escalation that reduces the incentive and capability for continued attacks. Carriers return to Suez-based loops at scale, effective capacity jumps, and spot rates fall. This can feel like a sudden return to normal, but it can also create whiplash operationally. Networks have to be rebuilt, schedules have to be re-stabilized, and equipment has to be repositioned.
The key point is that a rapid return can be as disruptive operationally as a rapid exit, even if it is economically positive. Some firms that over-ordered inventory at high freight costs may face margin pressure as rates fall. Some ports that benefited from detours may see activity drop.
Signals to watch: coordinated diplomatic announcements that reduce regional tension, insurers expanding coverage at lower premiums, carriers restoring full Suez rotations, and a rapid softening of Asia to Europe spot rates.
Scenario C: Entrenched Risk Premium And A Semi-Permanent Reroute World
In this path, the Red Sea remains contested enough that avoidance becomes the default for a long period. The world adapts, but at a cost. Supply chains redesign around longer lead times. Inventory levels rise structurally for critical goods. Prices stay higher than they otherwise would be, even if inflation rates eventually settle.
This scenario has the largest long-term implications because it changes investment. It encourages nearshoring, regional manufacturing, and new logistics corridors. It also increases the strategic value of alternative routes and ports.
Signals to watch: repeated incidents that prevent confidence from rebuilding, sustained high insurance pricing, continued low canal transits, and long-run contract pricing that embeds higher freight assumptions.
To help make these paths operational for decision-makers, here is a simple comparison of what each scenario would likely do to the variables that matter most.
| Scenario | Freight Rates | Insurance Premiums | Canal Traffic | Inventory Behavior | Political Pressure |
| Gradual normalization | High variance, gradual easing | Slowly easing, still elevated | Partial recovery | Selective buffer building | Continued diplomacy focus |
| Fast reset | Sharper decline | Meaningful decline | Strong recovery | Some destocking later | Pressure shifts to rebuilding |
| Entrenched premium | Higher baseline | Persistently high | Low baseline | Structural “just-in-case” | High fiscal and security strain |
There are also milestones to watch that have outsized influence on perception. Markets often move when a threshold is crossed, not when incremental news arrives. Examples include a sustained period without major incidents, a formal diplomatic arrangement that changes incentives, a major insurance market shift, or a coordinated carrier decision to restore routing.
From a policy perspective, the biggest question is not whether naval missions can intercept threats. It is whether the region can reach a political equilibrium that reduces the motivation for maritime disruption. That is why diplomacy remains central even when the problem looks like a security issue. It is also why this crisis keeps returning to the agenda of top-level envoys. The economic penalties are too clear to ignore.
From a business perspective, the practical lesson for 2026 is that resilience is no longer a side project. It is becoming a core competency. Firms that treat shipping as a fixed cost will be surprised repeatedly. Firms that treat it as a strategic variable, with hedging strategies, flexible routing, and diversified sourcing, will have a durable advantage.
The Red Sea shipping crisis is not just a story about vessels and premiums. It is a story about how geopolitics is being priced in real time through freight, insurance, and lead times. Whether the next phase is normalization or entrenchment will depend on security conditions and the credibility of diplomacy. For 2026, the safest assumption is continued volatility, with occasional spikes that punish complacency and reward preparation.