Missing or wrong items make shoppers angry and drive them away. 85% of shoppers will not buy again after a bad delivery experience. This post covers five logistics KPIs, like order accuracy, inventory turnover and on-time delivery rate, and shows how shipping software and warehouse management systems track them.
Ready to boost your metrics?
Key Takeaways
- A single bad delivery can drive away 85% of shoppers, so tracking logistics KPIs is key to keeping customers.
- Order accuracy = (accurate picks / total picks) × 100. Top brands hit 98–99%. Use WMS, barcode scans, staff training, and automation to cut mistakes.
- On-time delivery rate = (orders on time / total orders) × 100. MCF posts 97% in the US and 99% in the UK. A rate below 95% flags fulfillment issues. Real-time TMS data helps you fix delays.
- Inventory accuracy = (physical count / recorded count) × 100. Aim for 100% with regular audits, cycle counts, barcode scans, and third-party support to avoid stockouts and wrong shipments.
- Boost efficiency and cut costs with a lean warehouse layout: put fast movers by docks, run straight aisles, add conveyors and label printers, and install real-time control software. Use IoT sensors, a TMS, AI/ML forecasts, mobile apps, carrier deals, freight audits, and 3PLs to slash cost per shipment and cost per mile.
What is order accuracy and why does it matter?
Order accuracy tracks how many orders you pick without mistakes. Shops use (Accurately picked orders / Total orders picked) × 100 to score it. Leading companies push that figure above 98%.
Reaching 98 to 99% counts as excellent. This KPI shapes your logistics management, boosts customer satisfaction, fuels customer experience, and lifts your perfect order rate.
Logistics teams use warehouse management software and scanning tools to nail picks. Inventory checks, staff training, and automation boost operational efficiency. Mistakes rack up return rates, hike costs, and hurt your brand.
You can dig into errors, test a new 3PL partner, or add an inventory management tool to raise that rate.
How do you measure on-time delivery rate?
A simple formula shows this key figure. You take orders delivered on time, divide by total orders, and then multiply by 100. This on-time delivery rate, a core KPI, gauges your promise keeping.
MCF posts over 97 percent in the US and more than 99 percent in the UK. Any score below 95 percent flags a fulfillment issue.
Delays pop up in pick, pack, or ship steps, or when a carrier misses a deadline. Many shops plug a transport management system into their supply chain management flow for real-time insight.
A data dashboard or a spreadsheet shows late spots and helps teams tweak processes. High rates drive customer satisfaction and loyalty, so you swap carriers, add automation, or tweak packing to keep shipments landing like clockwork, not at a snail’s pace.
What is inventory accuracy and how can it be improved?
Inventory accuracy rate measures the match between actual and logged stock. You calculate it with the formula (Physical count / Recorded count) x 100. Aim for 100% inventory accuracy.
Inaccuracies lead to delays, wrong shipments, and unhappy customers.
Periodic counts and regular audits catch mistakes early. Scanning tools and an inventory system keep data fresh. Outsourcing tasks to a third-party partner frees your team to focus on customer satisfaction.
Cleaner data cuts stockouts, trims transportation costs, and shortens order cycle time.
Warehouse efficiency metrics to track
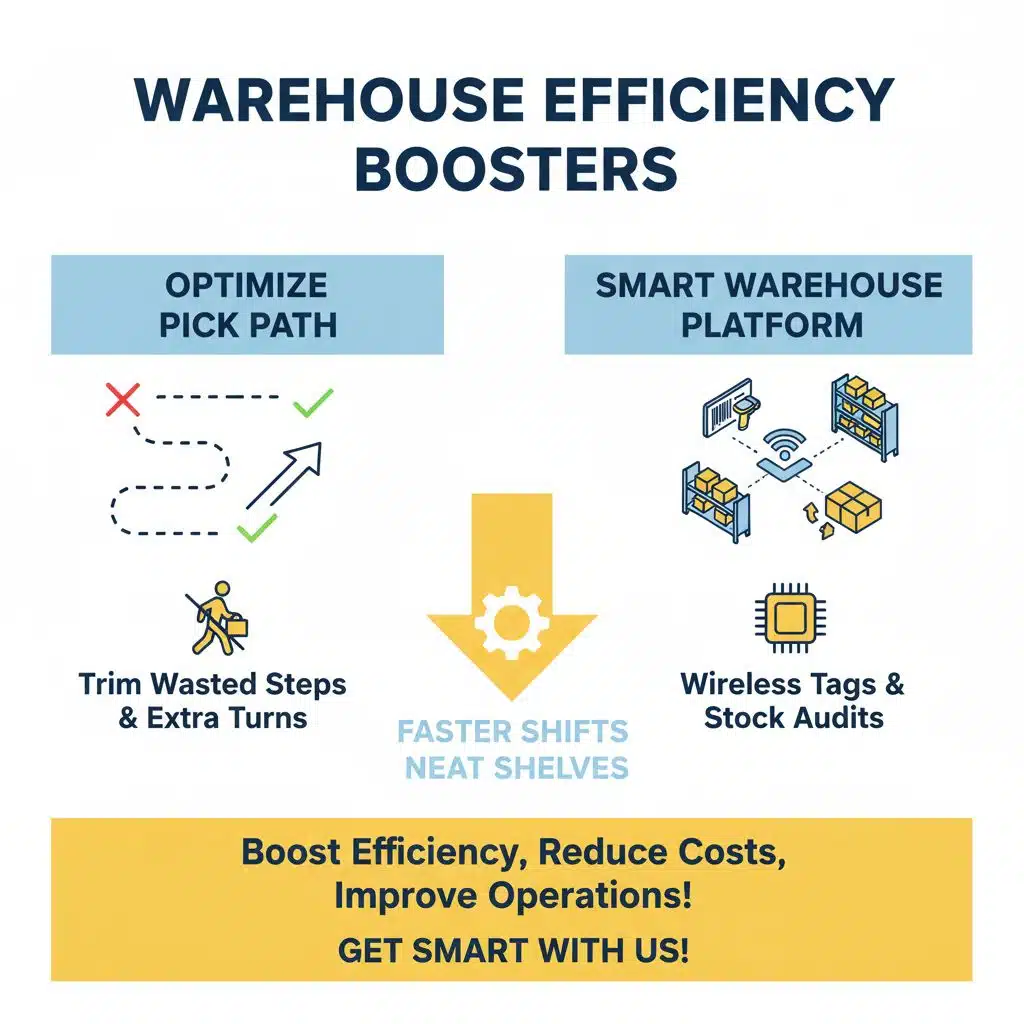
Pick path length can flag wasted steps on the floor, so you trim every extra turn. A warehouse management platform uses wireless tags and stock audits to serve neat shelves and faster shifts, greasing the wheels of your operation.
How can you optimize warehouse layout for efficiency?
Warehouse layout drives operational efficiency. It speeds up order processing.
- Place fast-moving items near shipping docks to cut travel time, boost order accuracy and lift operational efficiency.
- Lay aisles in straight lines to shorten order cycle time and support key performance indicators for logistics KPIs.
- Fit machines like label printers and stock counters to drive down errors, hit 99% inventory accuracy and speed cycle counts.
- Install control software to track inventory in real time, improve the order accuracy rate and power inventory management.
- Build conveyors to move boxes quickly, lower cost per order and push order fulfillment above 95%.
- Add a TMS to link carrier management, optimize routes, boost on-time delivery rate and trim shipping costs.
What technologies improve warehouse productivity?
IoT sensors scan bins and aisles, feeding data to a WMS that cuts manual errors. That system can lift order picking accuracy above 98 percent. A TMS tracks on-time delivery rate and logs freight bill accuracy, giving clear logistics KPIs.
Cross-functional teams boost inventory management by using AI/ML for demand forecasts, speeding cycle counts. Route optimization tools plan fleet runs, trimming shipping costs. Mobile apps link floor staff with supervisors, speeding response times, lifting customer satisfaction.
How can transportation costs be reduced in e-commerce?
Transportation costs can drain profits fast. Smart steps can cut fees on fuel, labor, maintenance, and tolls.
- Plan routes with optimization tools and live traffic feeds. This cuts fuel bills, boosts miles per gallon, and lowers maintenance fees.
- Use fleet management systems for real-time tracking, maintenance alerts, and driver logs. Teams can spot idle time, avoid breakdowns, and trim labor costs.
- Negotiate volume rates with carriers like FedEx, USPS, or DHL. Lower fees lift profit margin and boost customer satisfaction.
- Outsource shipping and warehousing to 3PL firms. Their networks slash cost per order and improve operational efficiency.
- Audit freight bills for billing errors. Correcting a mischarge can save hundreds each month.
- Track logistics KPIs such as cost per shipment, shipping costs per mile, and on-time delivery rate. Data helps spot waste and guide strategy.
Takeaways
Tracking the right metrics keeps your logistics ship sailing smoothly. You can plug in a route planner to slash delivery spend, a stock tracker to cut mismatches, and a CRM platform to boost repeat sales.
Hot order accuracy, on-time delivery, and inventory accuracy win customer loyalty. Quick order cycle time lets you spot slowdowns fast. Small tweaks in your dashboard today deliver major wins tomorrow.
FAQs on Key Metrics for E-Commerce Logistics Success
1. What is on-time delivery rate?
It tells you how many orders arrive by the date you promise. It shows how fast your supply chain runs.
2. How do I measure order cycle time?
You count days from the moment a buyer clicks pay to the day they hold the box. Note the order date, note the arrival date, then subtract.
3. Why track inventory turnover rate?
It shows how fast stock flies out of your warehouse. A high rate cuts storage fees, clears space, and shrinks return rate.
4. What does order accuracy rate tell me?
It shows the share of orders that ship without missing items or errors. Good accuracy makes happy buyers, builds brand loyalty, and cuts return expenses.
5. How do shipping costs affect profit ratio?
Add up all freight and pack fees, then divide by total sales. If shipping costs rise, your profit ratio will dip quickly.
6. What is perfect order rate?
It bundles on-time delivery rate, order accuracy rate, a full invoice, no damage, and the right pack. A strong perfect order rate drives customer lifetime value and spotlights key performance indicators.