The AI Market Correction 2026 debate is intensifying because spending and valuations are racing ahead of proven, repeatable ROI. With trillion-scale forecasts, record infrastructure buildouts, and crowded market leadership, 2026 looks like the year investors stop paying for possibility and start paying for proof.
How We Got Here: From Breakthrough To Buildout?
Two things became true at the same time. First, AI stopped being a lab novelty and turned into a procurement line item. Stanford’s 2025 AI Index highlights that organizational AI use jumped sharply in 2024, and private investment stayed massive, especially in generative AI. Second, the market began to price AI not as a product cycle, but as a platform shift that remakes entire industries.
That combination creates a familiar setup. When a technology’s usefulness becomes obvious, capital tends to arrive early and in bulk. Then expectations grow faster than implementation reality. In the late 1990s, the internet was real, but many business models were not. In the 2010s, mobile was real, but many app valuations assumed frictionless monetization. In the 2020s, cloud was real, but some firms overbuilt and later learned that utilization and margins, not raw capacity, determine returns.
AI is now in that “industrialization” phase. The winners are building chips, data centers, networks, and AI-enabled software. The risk is timing. Spending is front-loaded, while value capture is delayed and uneven across industries. In that gap, a correction can happen without AI failing as a technology.
Why 2026 Feels Like A Stress Test For Valuations?
The clearest warning light is not a single scandal or a sudden AI winter. It is market structure. A narrow group of companies has carried a large share of index performance, while valuation multiples have expanded alongside AI optimism.
A Reuters analysis published January 7, 2026 notes that U.S. stocks began 2025 with a very high 12-month forward P/E of about 25, and still delivered a 16% gain in 2025. It also points out a pattern seen by Deutsche Bank across dozens of indices: markets that started the year cheaper generally performed better by year end, and expensive markets tended to lag.
Goldman Sachs Asset Management’s Investment Outlook 2026 adds the concentration layer. It reports the top 10 U.S. stocks account for about 40% of the S&P 500’s market capitalization and around 30% of earnings, and those 10 names represent close to 25% of global equity market value.
That is not a crash forecast. It is a description of fragility. When leadership is concentrated, “good but not perfect” earnings can still trigger repricing.
| Valuation And Concentration Snapshot | What It Shows | Why It Matters In 2026 |
| S&P 500 2025 return | +16% (2025) | Strong gains raise the bar for 2026 earnings guidance |
| Starting valuation signal | U.S. started 2025 near 25x forward P/E | High starting multiples leave less room for disappointment |
| Index concentration | Top 10 ≈ 40% of S&P 500 market cap | A few earnings calls can move the entire index |
| Earnings concentration | Top 10 ≈ 30% of S&P 500 earnings | Revisions to a small group can reprice “the market” |
| Global exposure | Top 10 U.S. stocks ≈ 25% of global equity market | Global portfolios share the same chokepoint |
The Capex Arms Race: Compute Is Becoming The New Leverage
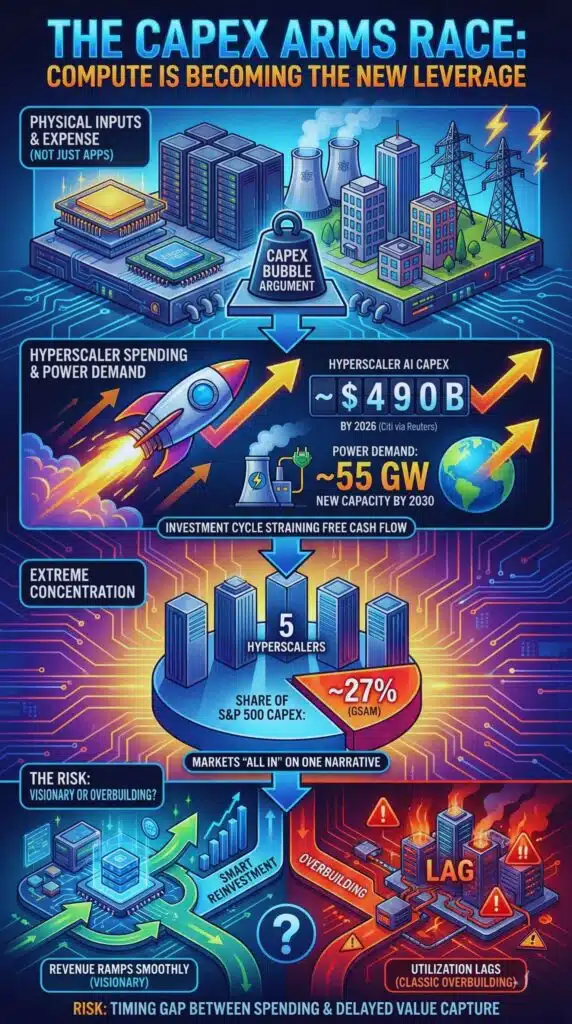
AI is expensive in a way that many software waves were not. The required inputs are physical: chips, racks, cooling, real estate, and power. This is why the “bubble” argument often centers on capex rather than on apps.
Citigroup told Reuters (September 30, 2025) that hyperscaler AI capital expenditures could reach about $490 billion by 2026. The same report estimated global AI compute demand could require roughly 55 gigawatts of new power capacity by 2030, tied to trillions in associated investment. Those numbers matter because they describe an investment cycle that can strain free cash flow, especially if companies borrow to finance buildouts.
Goldman Sachs Asset Management’s outlook adds a key detail about who is driving that buildout: it estimates five major hyperscalers are responsible for about 27% of S&P 500 capex. That is a stunning share for a handful of firms, and it helps explain why markets feel “all in” on one narrative.
If revenue ramps smoothly, the buildout looks visionary. If utilization lags, the same buildout becomes a classic overbuilding story.
| Capex And Infrastructure Signals | Latest Reference Point | The Investor Question For 2026 |
| Worldwide AI spending forecast | ~$1.5T in 2025 (Gartner) | Is demand broad-based or concentrated in a few buyers? |
| Next-step spending expectation | Spending projected to top $2T in 2026 (reported from Gartner research coverage) | Does monetization keep pace with spending growth? |
| Hyperscaler AI capex | ~$490B by 2026 (Citi via Reuters) | Do margins and cash flows hold up while capex surges? |
| S&P 500 capex share | Five hyperscalers ≈ 27% (GSAM) | Is this smart reinvestment or arms-race insurance? |
| AI infrastructure monetization example | NVIDIA FY2025 revenue $130.5B (press release) | Are “picks and shovels” profits durable if apps churn? |
Private Markets: The Return Of Mega-Rounds And The Risk Of Down Rounds
A correction often begins in private markets before it shows up in public indices, because private valuations can stay “sticky” until funding windows close.
Crunchbase’s global venture funding report (January 7, 2026) says venture and growth investors put about $425 billion into more than 24,000 private companies in 2025. The report also says roughly half of global venture funding in 2025 went to AI-related fields, with AI receiving about $211 billion, up sharply year over year. It highlights extreme concentration at the top: five AI companies alone raised $84 billion in 2025, about 20% of all venture capital funding that year.
This matters for 2026 because large late-stage rounds raise the “valuation floor” that exits must clear. If IPO markets stay selective and M&A does not absorb supply, many startups face a simple choice: grow into the valuation, accept a down round, or sell.
A market correction in this context is not a collapse of AI usage. It is a repricing of claims on future cash flows.
| Private-Market Heat Indicators | 2025 Reading | Why It Shapes 2026 Outcomes |
| Global venture funding | ~$425B | More capital can prolong weak unit economics |
| AI share of venture funding | ~50% | Non-AI sectors may struggle to raise |
| Venture funding into AI | ~$211B | AI becomes the default growth narrative |
| Concentration in mega-rounds | Top five AI firms raised ~$84B | Crowding increases systemic fragility |
| Capital concentration | ~60% of invested capital to 629 big-round companies | Mid-tier startups face tougher funding odds |
Enterprise Reality: Adoption Is Rising, But ROI Is Still Uneven
The correction thesis is not “AI does nothing.” It is “AI does not monetize evenly, fast, or cleanly.”
Stanford’s AI Index 2025 reports that 78% of organizations said they used AI in 2024, up from 55% the year before. It also reports U.S. private AI investment reached $109.1 billion in 2024, and global private investment in generative AI reached $33.9 billion.
Those adoption numbers are real. The tougher part is conversion into measurable outcomes. Many organizations can pilot AI in weeks, but scaling often takes quarters because it requires data cleanup, workflow redesign, security reviews, and governance. This is where investors will demand sharper proof in 2026: not that a chatbot exists, but that costs fell, revenue rose, or risk declined in ways competitors cannot instantly copy.
The most durable benefits tend to appear in specific workflows:
- Customer support resolution and deflection.
- Code generation and test automation in mature engineering orgs.
- Fraud detection and claims processing in financial services.
- Document-heavy compliance and research tasks.
The weakest returns often show up when firms add AI as a feature without changing the underlying process.
| Where AI ROI Tends To Show First | What Gets Measured | What “Proof” Looks Like In 2026 |
| Customer operations | Cost to serve, handling time, escalations | Lower cost per ticket without lower CSAT |
| Sales and marketing | Lead qualification, cycle time, conversion | Higher revenue per rep, not just more content |
| Software engineering | Velocity, defect rates, incident volume | Faster releases with stable reliability |
| Finance and procurement | Close time, forecasting error, savings rate | Documented savings that pass audit scrutiny |
| Risk and compliance | Review time, false positives, incident rates | Stronger controls with fewer manual hours |
Commoditization Is The Quiet Pin: Models Improve, Pricing Power Shrinks
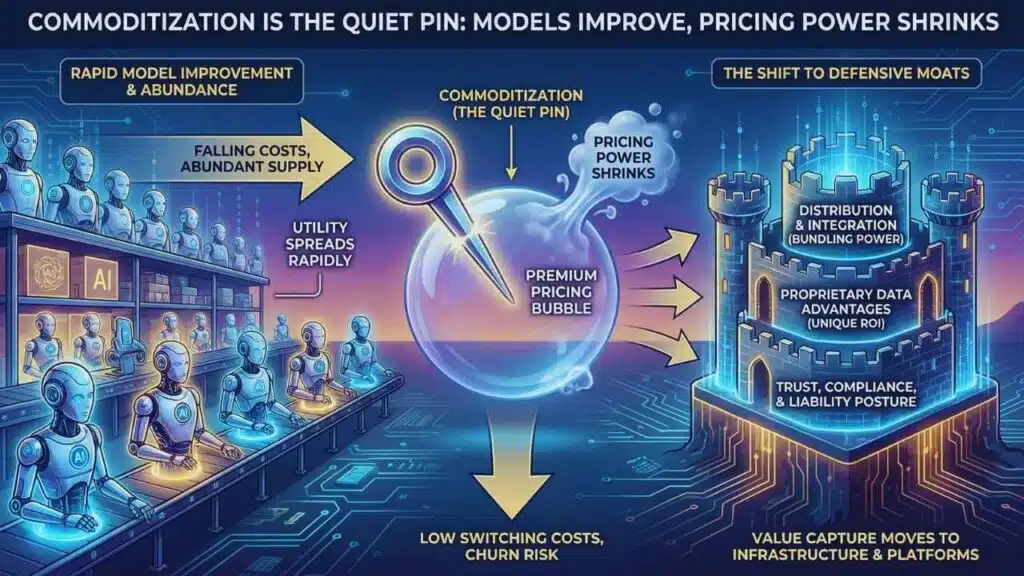
Even if AI utility grows, “AI companies” can still disappoint investors if margins compress. One reason is that model capability is spreading rapidly and costs are falling, which benefits adopters but threatens premium pricing.
In this environment, the moat often shifts away from “best model” toward:
- Distribution and default placement.
- Proprietary data advantages.
- Product integration that reduces switching.
- Trust, compliance, and liability posture.
This is where a 2026 correction can look like dispersion rather than a crash. Infrastructure and platform firms that capture recurring spend can hold up, while “AI wrappers” with low switching costs get repriced quickly.
A practical way to think about 2026 is not “AI winners vs AI losers.” It is “moat vs no moat.”
| Competitive Position | Typical Strength | Correction Risk In 2026 |
| Infrastructure leaders | Multi-year demand visibility | Medium, mostly multiple compression |
| Scaled platforms | Distribution and bundling power | Medium, depends on margins |
| Vertical AI with proprietary data | Defensible ROI in one domain | Lower if outcomes are measurable |
| Generic AI apps | Easy to copy and switch | High, churn and pricing pressure |
| Services-only AI consultancies | Execution helps, but margins vary | Medium to high if differentiation is weak |
Energy, Inflation, And The Cost Of Compute: The Macro Channel Into A Correction
If there is a single “outside trigger” that could turn AI exuberance into a correction, it is macro. When rates stay higher for longer, long-duration growth assets reprice quickly.
Reuters reporting (January 5, 2026) describes investor concern that AI-linked investment could add to inflation pressures, partly through higher costs for chips, energy, and large-scale construction, and it cites expectations that U.S. inflation could remain above the Federal Reserve’s 2% target through 2027.
The energy side is no longer theoretical. The International Energy Agency’s Energy and AI work (April 10, 2025) projects that electricity demand from data centers worldwide is set to more than double by 2030 to around 945 TWh. It also projects electricity demand from AI-optimized data centers could more than quadruple by 2030. It warns of uncertainty, but the direction is clear: power and grid capacity are becoming constraints.
This matters because it turns AI into an “inputs story.” If the inputs inflate, ROI math changes.
| Energy And Inflation Pressure Points | Reported Metric | Why Investors Care |
| Data center electricity demand | ~945 TWh by 2030 (IEA projection) | Power costs and availability shape AI margins |
| AI-optimized data center growth | More than quadruple demand by 2030 | Compute scarcity can raise prices and delay rollouts |
| U.S. electricity growth driver | Data centers near half of demand growth to 2030 (IEA) | AI becomes a macro factor, not just tech |
| Inflation risk narrative | Inflation may stay above 2% target through 2027 (investor expectations cited by Reuters) | Higher rates can compress valuation multiples |
| Capex financing | Borrowing rising in buildout (Citi via Reuters) | Leverage makes cycles sharper in downturns |
Regulation And Trust: Compliance Costs Will Separate Serious Operators
Regulation is often framed as an innovation brake, but in 2026 it may function more like a market filter. Compliance is expensive. That tends to favor incumbents and well-capitalized challengers.
The European Parliamentary Research Service timeline (June 2025) notes that the EU AI Act entered into force in 2024, with a general date of application of 2 August 2026, and that the act should be fully effective by 2027. For companies selling into Europe, that timing intersects directly with the “prove ROI” year in markets.
Regulatory pressure also strengthens demand for “boring” AI products that investors sometimes ignore during hype phases:
- Model monitoring and audit trails.
- Data governance.
- Cybersecurity and incident response.
- Explainability tooling in regulated workflows.
A correction can redirect capital from flashy demos to compliance-grade infrastructure.
| EU AI Act Timing Markers | Date Reference | Business Implication In 2026 |
| Regulation entered into force | 2024 | Compliance planning shifts from optional to mandatory |
| General date of application | 2 Aug 2026 | Many obligations start to bite during 2026 |
| Full effectiveness | By 2027 (per EPRS) | Longer compliance runway for firms that invest early |
Expert Perspectives: Why Reasonable People Disagree
A strong analysis needs the counter-case. The bull view is not irrational. It is grounded in real monetization at the infrastructure layer and the plausibility of broad productivity gains.
The bull case argues:
- Spending forecasts are large because AI is being embedded into devices, enterprise software, and core infrastructure.
- The biggest firms have the balance sheets to fund multi-year buildouts.
- Even if a few startups fail, the ecosystem still expands.
The bear case argues:
- Capex can outrun demand, and overbuilding creates margin compression.
- Concentration increases systemic fragility.
- Commoditization reduces pricing power faster than models improve.
The middle view is that 2026 is a sorting year. AI stays real, but market pricing becomes stricter. Returns accrue to firms that can show repeatable unit economics, not just rapid user growth.
OECD’s warnings about AI-related market optimism as a downside economic risk, and the investor concerns around inflation pressures reported by Reuters, reinforce that even policy and macro observers see a path where markets reprice without AI adoption reversing.
What To Watch Next: A Practical 2026 Checklist?
If you want early signals of whether AI’s boom is heading toward correction or sustainable expansion, watch these milestones:
- Guidance vs capex
If capex stays high while revenue timelines slip, markets will re-rate.
- Utilization metrics
Data center utilization and AI service attach rates matter more than headline spend.
- Enterprise proof at scale
Look for audited savings, productivity metrics, and repeatable deployments.
- Pricing pressure
Falling inference costs help buyers, but can compress vendor margins.
- Power constraints
Grid delays and permitting friction can slow rollout and raise costs.
- Regulatory deadlines
Compliance readiness becomes a competitive advantage, not an afterthought.
Future Outlook: A Correction Would Not Kill AI, It Would Clarify It
The most likely outcome for the AI Market Correction 2026 conversation is not a clean “bubble pops” moment. It is dispersion. Public markets can re-rate even as AI usage rises. Private markets can cool even as enterprise budgets expand. The durable winners will be those that translate AI into measurable outcomes while defending pricing power.
If a correction arrives, it may ultimately strengthen the sector by forcing focus on:
- Defensible moats rather than demos.
- Cash flow and utilization rather than capex headlines.
- Compliance-grade deployment rather than experimental sprawl.
That would make the next phase of AI less glamorous, but more real. And if history is a guide, that is when the biggest long-term companies are built.