In the fast-moving world of currency exchange, real-time insights are not just a competitive edge—they are a necessity. With the evolution of technology and the increasing need for immediate decision-making, financial professionals are turning to real-time analytics dashboards powered by broker forex data to gain comprehensive market visibility.
This article explores how broker forex data can be integrated into advanced analytics dashboards, the benefits such integration provides, and key components to consider when designing and implementing these tools. Without referencing specific companies or personalities, we aim to provide a technical and informative overview of this growing trend in financial analytics.
Why Real-Time Analytics Matter in Forex
Forex trading operates 24 hours a day, five days a week, with fluctuations driven by global events, market sentiment, interest rate changes, and more. Delayed or outdated information can lead to suboptimal trading decisions. Real-time analytics dashboards serve to aggregate and visualize broker forex data instantly, providing actionable insights at a glance.
Key benefits of real-time analytics dashboards:
- Immediate insight into market conditions.
- Automated alerts for predefined trading signals.
- Streamlined decision-making with visualized data.
- Improved risk management through real-time metrics.
These tools are especially valuable for portfolio managers, institutional traders, analysts, and even algorithmic trading systems.
Types of Data Offered by Broker Forex Platforms
Broker forex platforms provide a wide range of market and account-level data that can be funneled into analytics dashboards. While the types of data can vary slightly depending on the provider, most offer the following:
| Data Type | Description |
| Bid/Ask Prices | Real-time quotes from liquidity providers |
| Spread Information | The difference between bid and ask, crucial for scalpers |
| Trade Execution Data | Executed order history, useful for performance analytics |
| Account Metrics | Balance, margin level, open trades, and unrealized P/L |
| Economic Indicators | Live economic calendar events with impact predictions |
| Historical Data | Candlestick patterns, OHLC (Open, High, Low, Close) prices |
Each of these data streams can be represented visually in charts, graphs, and tables within a dashboard interface, offering a complete overview in a single screen.
Architecture of a Forex Analytics Dashboard
Developing a forex analytics dashboard that harnesses broker forex data in real time involves a multi-layered architecture:
- Data Ingestion Layer
This layer fetches data from broker APIs. Most platforms offer REST or WebSocket APIs for streaming price and trade data.
- Data Processing Layer
Utilizes in-memory data processing tools (e.g., Kafka, Spark) to clean, normalize, and transform data streams for consumption.
- Storage Layer
Stores structured historical data for backtesting and trend analysis—commonly used solutions include time-series databases like InfluxDB or TimescaleDB.
- Visualization Layer
Displays insights through custom dashboards, using tools like Grafana, Kibana, or custom-built frontends.
- User Interface (UI)
Provides the user with interactive capabilities such as filtering data, setting alerts, or running custom queries.
Key Use Cases for Broker Forex Dashboards
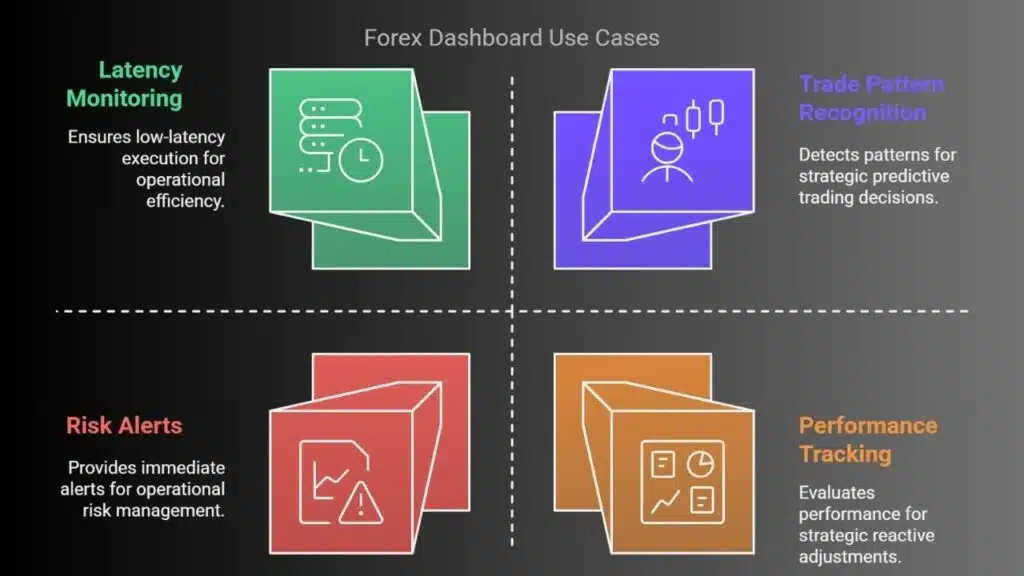
By leveraging broker forex data in a dashboard format, users gain enhanced operational and strategic capabilities. Some common applications include:
- Trade Pattern Recognition: Detect repetitive market behaviors for predictive strategies.
- Latency Monitoring: Ensure low-latency execution across systems.
- Risk Alerts: Set thresholds for margin levels, drawdowns, or unexpected market volatility.
- Performance Tracking: Evaluate individual or aggregate trading performance over time.
These use cases highlight how such dashboards are not merely passive displays but active components of a trader’s toolkit.
Designing Effective Visuals and Interactions
The effectiveness of a real-time analytics dashboard lies in its usability and clarity. Visual clutter or overly complex interfaces can hinder performance. When designing the UI, consider the following:
- Use minimalistic charts for fast comprehension.
- Highlight anomalies through color-coded alerts or icons.
- Include filters for currency pairs, timeframes, or account IDs.
- Incorporate drill-downs for deeper analysis from summary charts.
Additionally, dashboards must be responsive and performant, especially when dealing with high-frequency updates.
Challenges and Considerations
Implementing a real-time dashboard based on forex broker data comes with several challenges:
- Data Volume & Velocity: Forex generates high-frequency data, requiring robust streaming and storage solutions.
- API Limitations: Some brokers impose rate limits or lack WebSocket support.
- Latency Issues: Delays in data transmission can reduce the accuracy of time-sensitive strategies.
- Security & Compliance: Sensitive trading data must be encrypted and handled according to regulatory standards.
Mitigation strategies include:
- Caching frequently accessed data.
- Using efficient serialization formats like Protobuf or Avro.
- Implementing role-based access control (RBAC) for multi-user environments.
Steps to Build Your Own Dashboard
Building a functional forex analytics dashboard doesn’t have to be overly complex. Here’s a simplified step-by-step guide:
- Choose a Broker API that provides the data feeds needed (ensure documentation availability).
- Set Up a Backend Service using Python, Node.js, or Go to interact with the API.
- Stream Data to a Message Queue (like Kafka or RabbitMQ).
- Process and Store Data using a time-series database.
- Build a Frontend Interface with JavaScript frameworks (React, Angular).
- Deploy on a Cloud Platform for scalability and global access.
This approach ensures modularity and scalability, making it easier to evolve the dashboard over time.
Final Thoughts
Integrating broker forex data into real-time analytics dashboards unlocks a new dimension of trading and market analysis. Whether for institutional or individual use, these dashboards provide clarity, automation, and actionable intelligence in a constantly shifting financial environment.
With the right architecture, tools, and design principles, such dashboards not only enhance user experience but also empower traders to make data-driven decisions—improving both performance and resilience in volatile markets.