

Investing in the stock market can seem like navigating a maze, but with the right tools and strategies, you can identify winning stocks and build a robust portfolio.
Among the essential tools is fundamental analysis, a comprehensive method for evaluating a company’s intrinsic value by examining its financial health, market position, and external influences.
This article outlines 15 fundamental analysis strategies for stock picking, equipping you with actionable insights to make informed investment decisions.
Why Fundamental Analysis Matters?
Fundamental analysis is the cornerstone of value investing. Unlike technical analysis, which focuses on price movements and charts, fundamental analysis digs into a company’s underlying business to assess its potential for long-term growth. By applying these strategies, investors can:
- Identify undervalued stocks with strong potential.
- Avoid overhyped stocks that lack solid fundamentals.
- Build a diversified portfolio tailored to specific financial goals.
With a focus on long-term returns, fundamental analysis helps investors separate emotions from facts, ensuring sound decision-making while reducing risk.
Core Components of Fundamental Analysis
Let’s take a closer look
1. Financial Statements as the Foundation
Understanding a company’s financial statements is the first step in fundamental analysis. These documents provide a snapshot of the company’s financial health and operational performance.
Key Financial Statements:
- Income Statement: Measures profitability over a specific period. It includes revenue, expenses, and net profit.
- Balance Sheet: Offers insight into the company’s assets, liabilities, and equity at a specific point in time.
- Cash Flow Statement: Tracks cash inflows and outflows, reflecting a company’s liquidity and ability to fund operations.
Example Table: Key Figures from Financial Statements
| Metric | Company A (2022) | Company B (2022) |
| Revenue (€) | 200M | 250M |
| Net Profit (€) | 20M | 15M |
| Operating Cash Flow (€) | 25M | 30M |
Actionable Insights:
- Look for steady growth in revenue and profits over multiple periods.
- Assess how effectively the company manages its assets and liabilities.
- Compare financial data with industry peers to identify strengths and weaknesses.
2. Key Ratios for Stock Evaluation
Financial ratios simplify complex financial data, offering a quick and clear understanding of a company’s performance and valuation.
Essential Ratios:
- P/E Ratio (Price-to-Earnings): Indicates whether a stock is overvalued or undervalued. A lower P/E can mean better value, but it varies by industry.
- D/E Ratio (Debt-to-Equity): Measures a company’s financial leverage. A ratio below 1 generally indicates manageable debt levels.
- ROE (Return on Equity): Shows how efficiently a company uses shareholders’ equity to generate profits.
Practical Example Table:
| Ratio | Company A | Company B | Industry Average |
| P/E Ratio | 15 | 20 | 18 |
| D/E Ratio | 0.5 | 1.2 | 0.8 |
| ROE (%) | 18% | 12% | 15% |
Pro Tip: Always compare ratios within the same industry for meaningful insights.
15 Fundamental Analysis Strategies for Picking Stocks
Let’s take a closer look at these fundamental analysis strategies for stock picking
1. Understand the Company’s Business Model
Before investing, it’s crucial to understand how a company generates revenue and its core products or services. A strong business model ensures resilience during market fluctuations.
Actionable Tips:
- Review annual reports for a detailed breakdown of the business model.
- Identify if the company operates in a growth, mature, or declining industry.
- Evaluate whether the business model adapts well to technological or market changes.
Case Study:
Apple’s business model thrives on hardware sales, but its growing emphasis on services (like iCloud and Apple Music) adds recurring revenue streams, enhancing its stability.
2. Evaluate Revenue and Earnings Growth
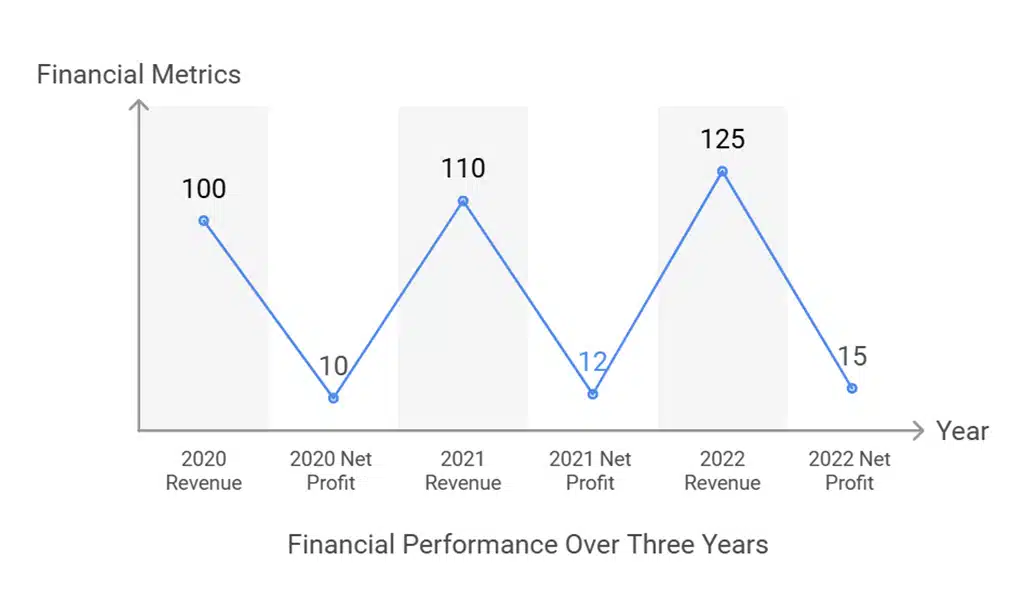
Consistent revenue and earnings growth signal a company’s ability to sustain operations and reward investors. Look for patterns over at least five years.
Practical Example Table: Revenue and Earnings Growth
| Year | Revenue (€) | Net Profit (€) | Growth Rate (%) |
| 2020 | 100M | 10M | 10% |
| 2021 | 110M | 12M | 12% |
| 2022 | 125M | 15M | 15% |
Actionable Tip: Companies with steady growth, especially in competitive industries, are often safer long-term investments.
3. Analyze Profit Margins
Profit margins reveal how efficiently a company converts revenue into profit. Higher margins indicate better control over costs and pricing power.
Types of Margins:
- Gross Margin: Revenue after deducting direct costs (e.g., materials).
- Operating Margin: Reflects profitability after operating expenses.
- Net Margin: Indicates overall profitability after all expenses.
Comparison Table: Profit Margins
| Metric | Company A | Company B | Industry Average |
| Gross Margin (%) | 45% | 50% | 48% |
| Operating Margin | 25% | 20% | 22% |
| Net Margin | 15% | 12% | 14% |
4. Assess the Company’s Debt Levels
Excessive debt can be a red flag, especially during economic downturns. Companies with manageable debt are better positioned to survive and thrive.
Key Debt Metrics:
- D/E Ratio: Indicates leverage.
- Interest Coverage Ratio: Shows the ability to cover interest payments with operating income.
Debt Metrics Table:
| Metric | Company A | Company B | Industry Average |
| Debt-to-Equity Ratio | 0.5 | 1.2 | 0.8 |
| Interest Coverage Ratio | 8.0 | 4.5 | 6.0 |
Pro Tip: A lower D/E ratio doesn’t always mean better—evaluate it alongside growth potential and industry standards.
5. Study Cash Flow Trends
Cash flow is the lifeblood of any business. Positive cash flow ensures that a company can pay its bills, invest in growth, and return value to shareholders.
Key Metric:
Free Cash Flow (FCF): Operating Cash Flow – Capital Expenditures.
Actionable Tip: Focus on companies with positive and growing FCF over time.
Example Table: Cash Flow Trends
| Year | Operating Cash Flow (€) | Capital Expenditure (€) | Free Cash Flow (€) |
| 2020 | 30M | 10M | 20M |
| 2021 | 35M | 12M | 23M |
| 2022 | 40M | 15M | 25M |
6. Investigate Return on Equity (ROE)
ROE reflects a company’s ability to generate profits from shareholders’ equity. It’s a critical measure of efficiency and profitability.
Formula:
ROE = Net Income / Shareholder’s Equity.
Practical Insights:
- A high ROE indicates effective management.
- Compare ROE across companies within the same sector.
7. Examine Dividend History and Payout Ratio

Dividends signal a company’s financial stability and commitment to rewarding shareholders. However, unsustainable payouts can strain finances.
Key Considerations:
- A consistent dividend history shows reliability.
- A payout ratio below 60% is considered sustainable.
Comparison Table: Dividend Analysis
| Metric | Company A | Company B |
| Dividend Yield (%) | 3.5% | 4.2% |
| Payout Ratio (%) | 50% | 65% |
| Dividend Growth Rate | 5% | 3% |
Market share reflects competitive strength and growth potential. Companies with a dominant market share are often better equipped to withstand competition and economic downturns.
Actionable Insights:
- Research market reports to understand a company’s position within its industry.
- Identify companies with increasing market share trends, which can indicate strong management and innovation.
Example:
A company with a 40% market share in a growing sector like renewable energy is likely better positioned for long-term growth compared to a competitor with a 5% share.
9. Study Economic Moats
Economic moats represent a company’s ability to maintain a competitive advantage over its peers. Strong moats protect profitability and market share from erosion.
Types of Moats:
- Cost Advantage: Companies like Walmart leverage economies of scale to offer lower prices.
- Brand Loyalty: Established brands like Coca-Cola command premium pricing and consistent demand.
- Network Effects: Platforms like Facebook become more valuable as more users join.
Actionable Tip: Focus on companies with multiple layers of competitive advantages for added stability.
10. Analyze Valuation Multiples
Valuation multiples help assess whether a stock is priced fairly compared to its earnings, assets, or cash flows. These metrics can uncover undervalued opportunities.
Key Metrics:
- P/E Ratio: Indicates how much investors are willing to pay for €1 of earnings.
- P/B Ratio (Price-to-Book): Compares the market value of equity to its book value.
- EV/EBITDA: Useful for comparing companies with different debt structures.
Example Table: Valuation Multiples
| Metric | Company A | Company B | Industry Average |
| P/E Ratio | 18 | 22 | 20 |
| P/B Ratio | 2.5 | 3.0 | 2.8 |
| EV/EBITDA | 10 | 12 | 11 |
Pro Tip: Low valuation multiples in combination with strong fundamentals can signal undervalued stocks.
11. Account for Macroeconomic Factors
Broader economic trends influence company performance. Understanding these factors helps investors anticipate potential risks and opportunities.
Key Factors:
- Interest Rates: Rising rates can increase borrowing costs and reduce profits.
- Inflation: High inflation can erode purchasing power and profit margins.
- Geopolitical Events: Trade wars or political instability can disrupt operations.
Actionable Tip: Monitor macroeconomic indicators and adjust your portfolio accordingly.
12. Investigate Insider Buying and Institutional Ownership
Insider buying often signals confidence in a company’s future prospects, while institutional ownership can reflect the stock’s credibility.
Actionable Insights:
- Use tools like Yahoo Finance or Bloomberg to track insider transactions.
- Look for stocks with a mix of insider and institutional ownership for balanced growth.
Example Table: Ownership Breakdown
| Ownership Type | Company A | Company B |
| Insider Ownership | 15% | 5% |
| Institutional Ownership | 60% | 75% |
13. Study Competitor Performance
Benchmarking a company’s performance against competitors provides valuable context for its strengths and weaknesses.
Key Metrics to Compare:
- ROE.
- Profit Margins.
- Debt Ratios.
Example Table: Competitor Metrics
| Metric | Company A | Company B | Industry Average |
| ROE (%) | 15% | 12% | 13% |
| Debt/Equity Ratio | 0.8 | 0.6 | 0.7 |
14. Analyze Long-Term Trends and Market Position
Investors should focus on industries with long-term growth potential, such as renewable energy, technology, or healthcare.
Case Study:
Tesla’s dominance in the EV market stems from innovation and a strong brand. By identifying similar trends, investors can capitalize on transformative industries.
Actionable Tip: Favor companies aligned with mega-trends like digital transformation or sustainability.
15. Incorporate ESG (Environmental, Social, and Governance) Factors
Sustainable investing has gained prominence, making ESG factors critical for evaluation. Companies prioritizing ESG are often better prepared for future challenges.
Actionable Steps:
- Review ESG ratings from platforms like MSCI.
- Evaluate initiatives like carbon neutrality and employee welfare.
Example Table: ESG Scores
| Metric | Company A | Company B |
| Environmental Score | 80 | 75 |
| Social Score | 85 | 70 |
| Governance Score | 90 | 80 |
Final Thoughts
The 15 fundamental analysis strategies outlined in this guide empower investors to make data-driven, confident decisions. By understanding financial health, market position, and industry trends, you can identify opportunities that align with your goals.
Start applying these strategies today to optimize your portfolio and achieve long-term success.