
Stock charts are indispensable for anyone serious about making informed decisions in the stock market. Whether you’re an experienced trader or just starting your investment journey, stock charts provide a visual representation of market activity, offering insights into price movements, trading volume, and overall trends. However, understanding these charts and leveraging them effectively requires more than just basic knowledge.
To truly excel in the world of investing, you need to adopt strategies for reading stock charts like a pro. These strategies empower you to identify patterns, predict market behavior, and make data-driven decisions that can lead to greater returns and minimized risks. By mastering the art of chart reading, you can confidently analyze historical data, anticipate price trends, and seize opportunities that others might overlook.
In this article, we’ll break down complex concepts into simple, actionable steps. From identifying key chart patterns to analyzing volume trends and understanding technical indicators, we’ll guide you through everything you need to know to navigate the stock market like a seasoned professional.
What Are Stock Charts?
Stock charts are visual representations of a stock’s price movement over time. They help investors track trends, analyze patterns, and make predictions about future performance. There are several types of stock charts, including line charts, bar charts, and candlestick charts, each serving different purposes.
Types of Stock Charts
| Chart Type | Description |
|---|---|
| Line Chart | Displays a stock’s closing prices over time, showing a simple, continuous line. |
| Bar Chart | Shows opening, closing, high, and low prices for each time period. |
| Candlestick Chart | Similar to bar charts but uses colored candlesticks to indicate price direction. |
Understanding these basics sets the foundation for mastering stock chart analysis.
Why Reading Stock Charts Matters
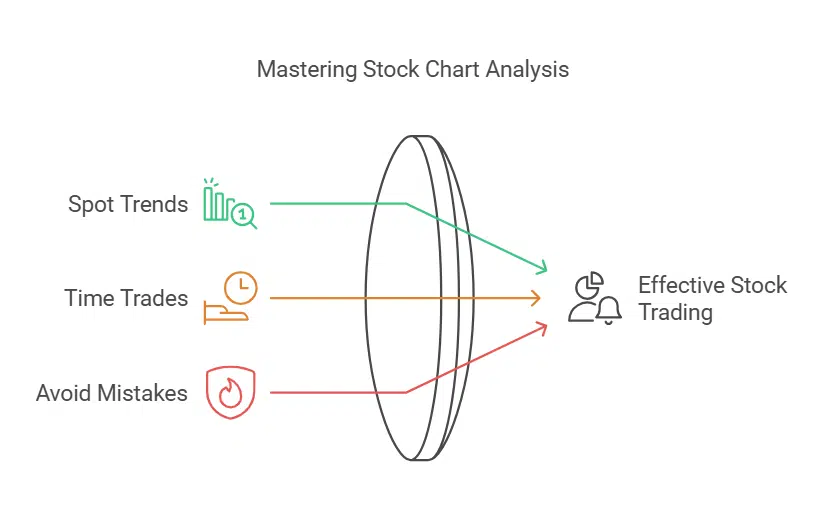
Reading stock charts is more than just looking at numbers; it’s about identifying opportunities and risks. By analyzing historical data, you can:
- Spot Trends: Recognize upward, downward, or sideways movements.
- Time Your Trades: Decide when to buy or sell based on market signals.
- Avoid Mistakes: Steer clear of common pitfalls like emotional decision-making.
Investors who understand stock charts have a significant advantage in navigating the complexities of the stock market.
1. Understand Key Chart Patterns
Chart patterns are visual cues that indicate potential price movements. They are broadly categorized into bullish (indicating price increases) and bearish (indicating price decreases).
Common Chart Patterns
| Pattern Name | Type | Description |
| Head and Shoulders | Bearish | A peak (head) flanked by two smaller peaks (shoulders), signaling a reversal. |
| Double Top | Bearish | Two peaks at the same level, suggesting resistance. |
| Cup and Handle | Bullish | A U-shaped pattern followed by a small dip, signaling a breakout. |
Recognizing these patterns helps you anticipate market movements more effectively.
2. Learn to Read Moving Averages
Moving averages (MAs) smooth out price data to highlight trends. They are calculated by averaging a stock’s price over a specific time frame.
Types of Moving Averages
| Moving Average | Description |
| Simple (SMA) | A straightforward average of prices over a period. |
| Exponential (EMA) | Gives more weight to recent prices for sensitivity. |
How to Use Moving Averages:
- Use the 50-day SMA to identify medium-term trends.
- Use the 200-day SMA to gauge long-term trends.
- Look for crossover signals, like when the 50-day SMA crosses above the 200-day SMA, which is a bullish sign.
3. Master Support and Resistance Levels
Support and resistance levels are crucial in understanding a stock’s price behavior.
- Support Level: The price point where a stock tends to stop falling and bounce back up.
- Resistance Level: The price point where a stock’s upward movement slows or reverses.
Tips to Identify Support and Resistance
| Factor | Method |
| Historical Prices | Look at previous highs (resistance) and lows (support). |
| Trendlines | Draw lines connecting multiple highs or lows. |
These levels help traders set entry and exit points effectively.
4. Analyze Volume Trends
Volume indicates the number of shares traded during a specific time period. It provides insights into market sentiment and confirms price movements.
Volume Analysis Tips
| Scenario | Interpretation |
| High Volume with Rising Prices | Indicates strong buying interest. |
| High Volume with Falling Prices | Signals strong selling pressure. |
| Low Volume in Sideways Markets | Suggests lack of interest and potential breakout. |
By observing volume trends, you can validate the strength of price movements.
5. Use Technical Indicators Wisely
Technical indicators supplement chart analysis by providing additional data. Popular indicators include:
Key Indicators
| Indicator | Purpose |
| RSI (Relative Strength Index) | Measures overbought/oversold conditions. |
| MACD (Moving Average Convergence Divergence) | Indicates trend strength and momentum. |
| Bollinger Bands | Highlights price volatility and potential breakouts. |
While indicators are helpful, avoid relying solely on them. Always combine them with other analysis methods.
6. Recognize Gaps in Charts
Gaps occur when a stock’s price opens significantly higher or lower than the previous day’s close. These gaps can indicate potential trading opportunities.
Types of Gaps
| Gap Type | Description |
| Breakaway Gap | Occurs at the start of a new trend. |
| Continuation Gap | Appears in the middle of a trend, confirming its strength. |
| Exhaustion Gap | Signals the end of a trend. |
Trading gaps effectively requires understanding their context within the overall trend.
7. Leverage Candlestick Patterns
Candlestick patterns offer detailed insights into price action by showing the open, close, high, and low prices.
Common Candlestick Patterns
| Pattern Name | Type | Description |
| Doji | Neutral | Indicates market indecision. |
| Hammer | Bullish | A small body with a long lower wick, signaling reversal. |
| Engulfing | Bullish/Bearish | A larger candle that engulfs the previous one, indicating a shift. |
Mastering candlestick patterns enables you to predict short-term price movements with confidence.
8. Follow the Time Frame That Matches Your Strategy
Different time frames suit different trading styles. Choosing the right one ensures your analysis aligns with your goals.
Common Time Frames
| Time Frame | Best For |
| 1-Minute Chart | Day traders seeking quick decisions. |
| Daily Chart | Swing traders aiming for medium-term gains. |
| Weekly Chart | Long-term investors analyzing broader trends. |
Adapt your strategy based on your chosen time frame and risk tolerance.
9. Common Mistakes to Avoid
Avoiding mistakes is as important as mastering strategies. Here are common pitfalls to steer clear of:
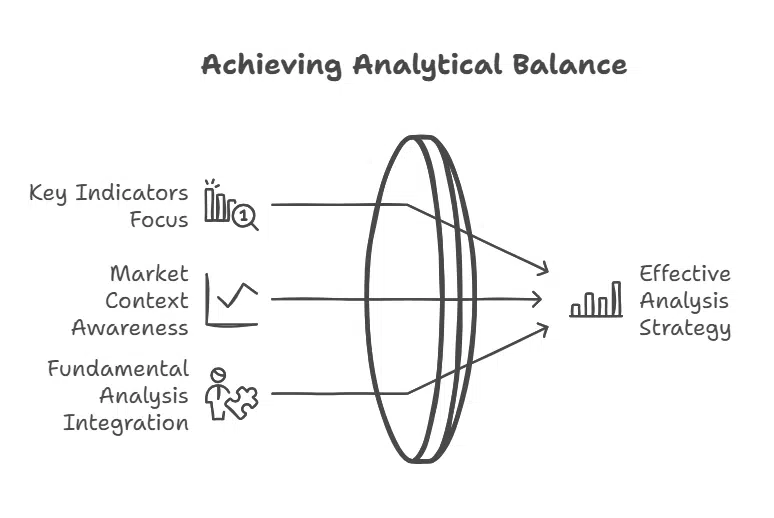
- Overcomplicating Analysis: Focus on a few key indicators instead of analyzing everything.
- Ignoring Market Context: Always consider broader economic trends.
- Neglecting Fundamental Analysis: Combine technical analysis with a company’s fundamentals for a holistic view.
10. Tools and Resources for Stock Chart Analysis
Investors today have access to numerous tools for chart analysis. Popular options include:
Top Tools for Chart Analysis
| Tool Name | Features | Pricing |
| TradingView | Advanced charting, social community | Free & Paid Options |
| Yahoo Finance | Basic charting, news integration | Free |
| MetaStock | Professional-grade analytics | Paid Subscription |
Choose tools that match your skill level and investment needs.
Takeaway
Reading stock charts is not just about understanding numbers and lines; it’s about uncovering the story behind market movements and using that knowledge to make smarter investment decisions. Adopting strategies for reading stock charts like a pro allows you to decode trends, identify opportunities, and avoid costly mistakes.
Mastering this skill takes time and practice, but the rewards are immense. By applying the strategies discussed in this article—such as recognizing key patterns, analyzing volume trends, and utilizing technical tools—you can approach the stock market with confidence and clarity. Remember, the key to success lies in a balanced approach: combine technical analysis with broader market insights and fundamental data for the best results.
So, take the first step today. Start implementing strategies for reading stock charts like a pro, and watch your investment decisions transform as you gain a deeper understanding of the market. Whether you aim for steady growth or high-impact trades, the knowledge you build will serve as your strongest asset in achieving financial success.