Many teams hit errors, timeouts, or slow HTTP requests. They face downtime, high response time, or CPU usage spikes in production. This gap in API reliability can waste hours and cause test delays.
API testing tools spot bugs ahead of time and cut test cycles. In this guide you get seven Tools To Easily Monitor And Test Your API Endpoints, like a versatile API client, a monitoring dashboard, and a docs-based tester.
You see how each one tracks memory usage, tests HTTP methods, and links into CI/CD. You get tips on synthetic monitoring and API analytics. Ready to fix your endpoints?
Key Takeaways
- 45% of testers love Postman. It runs automated tests on REST, SOAP, and GraphQL APIs. It tracks response time, CPU usage, memory use, and error rates. It links to Jenkins, cloud services, and databases for CI/CD.
- SoapUI is an open-source tool under the Apache license. It tests REST and SOAP APIs with functional, load, and security checks via Groovy scripts. It logs response time, CPU usage, memory use, and full API calls. You can link it to Jenkins or TeamCity for CI/CD.
- Datadog offers real-time APM and observability. It runs synthetic checks every minute. You see traces, logs, and metrics like response time, CPU usage, memory use, and error rate on live dashboards. It ties infrastructure and app monitoring for fast alerts.
- 37% of developers choose Katalon Studio for API testing and CI/CD integration. It fires scheduled REST API tests and shows charts for response time, CPU usage, and memory use. It halts builds on failures and posts HTML or PDF reports in chat or email. It links to Jenkins, GitLab, and GitHub Actions.
- Swagger UI, Moesif, and Prometheus cover docs, analytics, and custom metrics. Swagger UI hosts live API docs in-browser. Moesif traces calls, logs CPU, memory, and response time, and alerts on delays over 200 ms. Prometheus collects metrics like response time, CPU usage, memory use, and error rate. It fires alerts on latency spikes or API reliability drops to keep uptime above 99%.
Postman
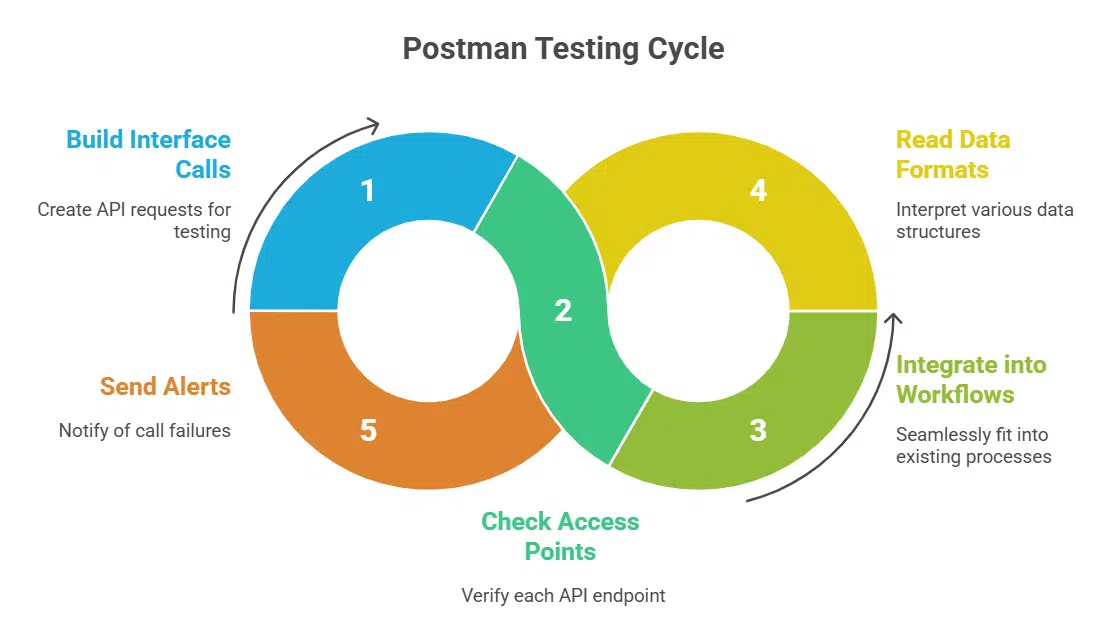
Postman gives testers a quick way to build interface calls, so they can check each access point with one click, all in a web client. It fits into build workflows, reads data formats and schema files, and sends a webhook or alert if a call fails.
Comprehensive API testing and monitoring features
Loved by 45% of testers, this user-friendly tool runs automated tests on REST APIs, SOAP APIs, and GraphQL APIs. Users import an OpenAPI specification or Swagger UI docs. Testers write scripts in JavaScript or Groovy to validate API responses.
It watches request methods, error rate, and simulates SQL injection attacks.
It tracks response time, CPU usage, memory usage, and requests per second. Synthetic monitoring and real user monitoring keep tabs on API reliability. Alerts fire when uptime drops or error rate spikes.
It links with Jenkins, databases, and cloud services for continuous integration.
Supports automated testing workflows and uptime monitoring
Postman runs continuous testing in CI/CD pipelines, like a build server or cloud builder. It triggers every code push and checks response time, CPU usage, and memory usage. Devs get alerts if an endpoint fails or shows errors.
Teams set up synthetic monitoring to ping APIs at fixed hours. Dashboards display uptime metrics.
Teams gain constant API monitoring and synthetic checks. Developers track error rates, latency and view api analytics daily. Postman hooks collections to CI servers for test automation.
This setup keeps services up and flags downtime fast. Engineers fix issues before clients notice.
SoapUI
SoapUI fires simple calls at SOAP and REST endpoints to catch errors fast, and logs each result with clear details. It hooks into your CI pipeline, so each code push clears performance checks without extra work.
Open-source tool for functional, load, and security testing
This open-source tool covers functional testing, load tests, and security checks. It works with REST APIs and SOAP APIs. It stays free under an Apache license. It lets your team script tests with Groovy, track response time, cpu usage, and memory usage.
It runs load tests on cloud servers. It scans for cross-site scripting and logs api requests and responses.
Developers call this app a Swiss army knife for api testing. You can set up automated tests, schedule runs, and fire them off from a browser or a CLI. The tool fits in DevOps workflows, catching errors before they hit production.
The package installs on Windows, Linux, and Mac. It supports test suites and reporting. It helps with api monitoring, uptime checks, and error tracking.
Ideal for both REST and SOAP APIs
SoapUI tests both REST and SOAP APIs with deep api testing and api monitoring tools. The open source app sets functional, load, and security tests with one click. Engineers learn its complex interface fast.
They use HTTP, JSON, and XML calls in custom scripts.
Users track response time, cpu usage, and memory usage with built-in metrics. They link to Jenkins or TeamCity for CI/CD workflows and scheduled runs. Teams catch api errors before they hit production.
They also set alerts for uptime and error rate.
Datadog
Datadog pulls real-time metrics from your apps, so you spot slow API calls before end users do. It uses APM to tag logs, traces, and alerts and map code hot spots in your client-server setup.
Real-time API performance monitoring and observability
This proprietary service tracks api performance in real time. It watches response time, cpu usage, memory usage, and error rate. Synthetic monitoring runs checks every minute. Dashboards display key metrics.
Developers spot slow endpoints fast.
The service adds observability for infrastructure monitoring and application monitoring. It logs traces across services and tracks distributed tracing. It sends alerts when thresholds rise.
Teams fix issues before they affect users. Engineers review api reliability trends at a glance.
Integrates seamlessly with infrastructure and application monitoring
Datadog hooks into servers, containers, and cloud services in minutes, feeding cpu usage, memory usage, and network metrics to live dashboards. It tracks api response time, error rate, and uptime as part of synthetic monitoring.
You run api testing scripts every minute, so you spot slow calls as they happen.
You map logs, traces, and custom metrics in one view for true api analytics. It pulls data from web services, application logs, and host metrics to give you a clear picture. Alerts fire on slow endpoints or high memory usage.
You keep api reliability high and boost api performance with proactive insights from a proprietary tool with extensive features.
Katalon Studio
Katalon Studio hooks into your DevOps pipeline like a trusty sidekick. It fires off API checks on schedule and drops neat reports.
User-friendly platform supporting API testing and CI/CD integration
Teams log into a clear dashboard. They send REST API calls. The interface shows response time, cpu usage, and memory usage in charts. It runs tests on query-endpoint calls too. It stores API documentation with your swagger files.
Users can track API monitoring, performance, and reliability in one view. They set up synthetic monitoring for uptime checks. The platform helps with performance testing and API management.
A survey shows 37% of developers pick it for its versatility.
Developers plug in Jenkins, GitLab continuous integration, or GitHub Actions with ease. Tests fire on every git push. The tool halts builds when tests fail. It posts reports in chat channels and email threads.
Sysadmins watch logs and api analytics in real time. They spot error rate spikes fast. The system logs failed test steps by code. Teams cut mean time to repair by running this setup.
Offers advanced scheduling and reporting features
Katalon Studio places API tests on a daily or hourly timeline. The tool logs each API request and response. It records response time, CPU use, memory use. You get detailed reports in HTML and PDF.
This view aids api monitoring and synthetic monitoring.
It links to continuous integration and delivery platforms like Jenkins and GitLab. This tie cuts error rate in your pipeline. Charts show failure trends, uptime scores, error tracking.
It feeds data to real user monitoring and distributed tracing tools. Leads keep test management and api analytics concise.
Swagger UI
Swagger UI spins up a small HTTP server that hosts your API doc in the browser. You can fire REST API calls and kick the tires on each endpoint, then click to keep reading.
Simplifies API testing with interactive documentation
Swagger UI gives devs a sandbox to fire API requests and see responses. This tool blends docs and testing in one view, cutting clicks and code setups.
It simplifies API testing for REST endpoints, but it has limited test scope.
Enables developers to visualize and test endpoints
This interface loads OpenAPI specs and turns them into live API documentation. Developers pick endpoints, tweak parameters, and hit send to view JSON. It paints a clear picture of api requests and api responses.
The design keeps documentation and testing side by side.
It plugs into CI/CD pipelines, running checks on every commit. Teams catch broken paths before they reach production. This setup cuts error rates and speeds up software development.
Engineers track cpu usage and memory usage under load. It boosts api reliability and cuts downtime.
Moesif

Moesif gives you real user monitoring and traces each API call like a bloodhound. You spot error spikes or slow API responses fast, then you banish performance gremlins before users get cranky.
Provides detailed analytics for API transactions
Platforms monitor and log each API transaction. They record response time, memory usage, and cpu usage. Dashboards show error rate and throughput trends. Teams spot slow endpoints in seconds.
That system uses api analytics to isolate bottlenecks instantly. The service adds distributed tracing and error tracking. Engineers rely on Moesif to troubleshoot performance issues fast.
Focuses on monitoring and troubleshooting API performance issues
Moesif tracks API transactions in real time. It logs CPU usage, memory usage, and response time. Engineers see error rate and traffic spikes on dashboards. Dashboards use trace tracking to spot slow calls and bottlenecks.
This tool runs scripted monitoring checks every minute. It uses API analytics and live user monitoring to reveal real trends. Alerts pop up on delays over two hundred milliseconds, so teams act fast.
Devs fix client errors and server lag, boosting API performance and reliability.
Prometheus
Prometheus fetches counters from probes, and saves them in a history store. You can set alerts for CPU usage or slow response times, and view charts in Grafana.
Open-source system for API and application monitoring
Teams use an open-source system for API and application monitoring, it brings many monitoring features. This tool collects cpu usage, memory usage, response time, error rate and cache hit rate.
It ties in synthetic monitoring, real user monitoring and distributed tracing.
Dev squads set custom metrics and alerts. A spike in http server latency or drop in api reliability triggers a warning. Teams link it with CI pipelines, view dashboards and fix issues fast, they keep uptime above 99 percent.
Offers custom metrics and alerting for API health
Prometheus runs as an open-source engine that gathers custom metrics on API health. It tracks response time, error rate, cpu usage and memory usage in real time, so developers can spot slow endpoints fast.
Alerts can push to Slack, email or PagerDuty for instant notification on api monitoring events. Such pipelines boost api reliability and simplify error tracking in cloud-based systems.
Takeaway
API client and SOAP tester let you run api tests without pain. Cloud monitor displays response time and cpu usage in real time. Test suite and doc explorer let you schedule checks and view docs at once.
Analytics tool tracks api analytics and error rate to keep api reliability high. Metrics server runs synthetic monitoring and alerts teams on outages fast.
FAQs on Must-Have Tools For API Endpoint Monitoring and Testing
1. What do API monitoring tools do?
They track your application programming interface health. They check response time, CPU usage, memory usage and error rate. They log API requests and API responses. They alert you fast so you can fix issues before they snowball.
2. How do these tools test REST APIs and GraphQL APIs?
They run API testing scripts, they send calls to your endpoints. They do load testing and API mocking. They watch caching and cache miss events. They report back with clear results.
3. Can I mix real user monitoring and synthetic monitoring?
Yes, you can. Real user monitoring shows live traffic. Synthetic monitoring acts like a bot that runs checks. I once saw it spot a broken link while I slept. It feeds data to API analytics.
4. Will these tools spot outages and slow HTTP servers?
They catch errors, they use error tracking and distributed tracing, it helps you see each call step. They watch CPU spikes or memory dips. They warn you before you face a crash.
5. How do they handle documentation and API security?
Some tools add Swagger UI or simple API documentation. They tie in with API management and governance. They keep spec and code on demand in sync. They help you lock down access, and guard your data.
6. Are these tools easy to set up and use?
They aim for ease of use. You can plug them into the cloud or your hybrid cloud. They run on your existing enterprise service bus. Many use open-source tools. You can be up and running before lunch.