The Morning Star candlestick pattern is a powerful tool in the arsenal of technical analysis for traders and investors in the Indian securities market. Understanding this pattern can provide valuable insights into potential trend reversals and help investors make informed decisions. This guide aims to elucidate the intricacies of the Morning Star pattern, offering a roadmap for new investors seeking to harness its potential.
What is the Morning Star Candlestick Pattern?
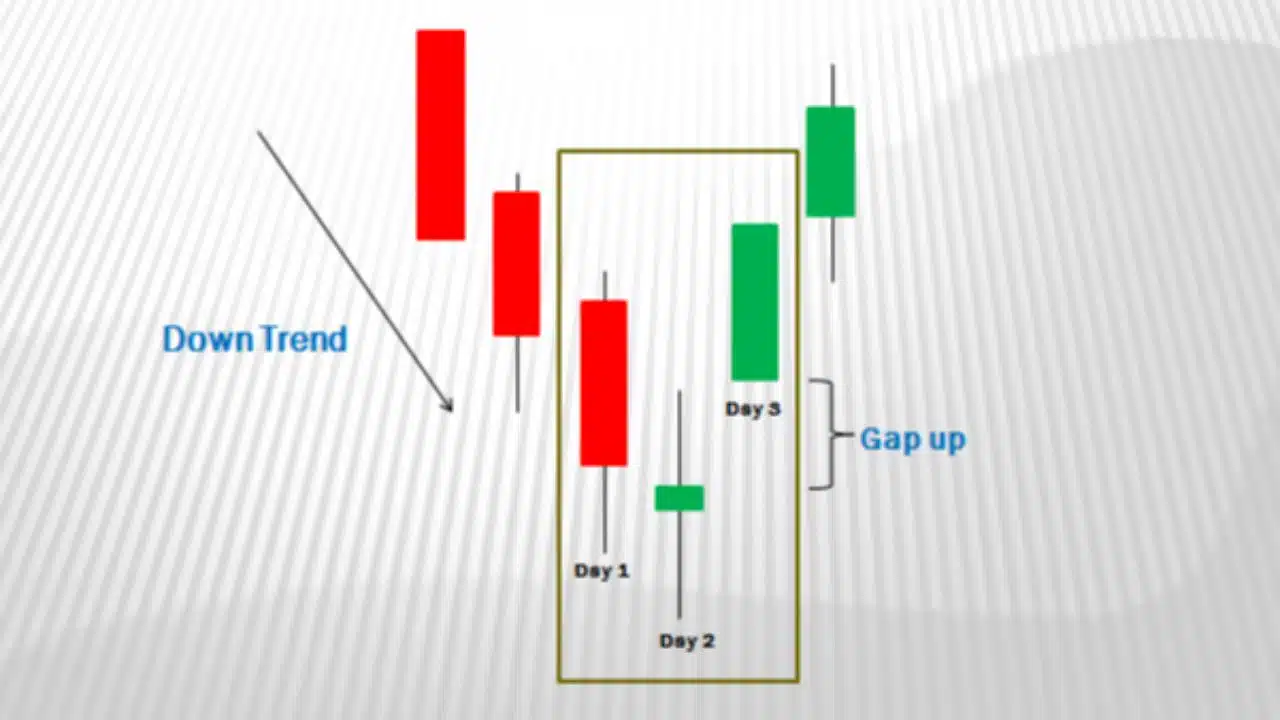
The Morning Star pattern is a bullish reversal pattern that typically forms at the end of a downtrend, signaling a potential upward reversal in the price of a security. It consists of three candlesticks:
- Bearish Candlestick: The pattern begins with a long bearish candlestick, indicating a strong downward momentum in the market.
- Indecision Candlestick: The second candlestick is a small-bodied candle that signifies indecision in the market. It may have a small body with long upper and lower shadows, reflecting a tug-of-war between buyers and sellers.
- Bullish Candlestick: The third candlestick is a bullish candlestick that opens higher than the close of the previous candle and closes near or above the midpoint of the first candle’s body. This bullish candlestick confirms the reversal signal, indicating a shift in momentum from bearish to bullish.
Key Characteristics of the Morning Star Pattern
- Confirmation: To validate the Morning Star pattern, it’s essential to observe a bullish candlestick succeeding the indecision candlestick, providing confirmation of the reversal signal and affirming the pattern’s significance. For a more detailed analysis, utilize a brokerage calculator alongside other technical indicators.
- Volume: Ideally, the volume should increase during the formation of the bullish candlestick, indicating strong buying interest and conviction among market participants.
- Gap: While not a strict requirement, a gap between the first and second candlestick enhances the reliability of the pattern.
Interpreting the Morning Star Pattern
The Morning Star pattern provides valuable insights into market sentiment and potential trend reversals. Here’s how to interpret the pattern:
- Downtrend Exhaustion: The formation of the Morning Star pattern at the end of a downtrend suggests that selling pressure may be nearing exhaustion, paving the way for a potential reversal in the price trend.
- Shift in Momentum: The transition from a strong bearish candlestick to a small-bodied indecision candlestick followed by a bullish candlestick signifies a shift in momentum from bearish to bullish.
- Buy Signal: The confirmation of the Morning Star pattern with a bullish candlestick serves as a buy signal for traders and investors, indicating an opportune moment to enter long positions.
Practical Application of the Morning Star Pattern
The Morning Star pattern holds significant value for traders and investors seeking to capitalize on potential trend reversals in the Indian securities market. Incorporating this pattern into trading strategies requires a nuanced understanding of its characteristics and practical application. Here’s how investors can effectively utilize the Morning Star pattern:
- Identifying Reversal Opportunities: The primary objective of utilizing the Morning Star pattern is to identify potential reversal points in the price trend. By scanning price charts for the formation of this pattern following a downtrend, investors can pinpoint opportunities to enter long positions.
- Confirmation with Volume Analysis: While the Morning Star pattern itself provides a strong bullish signal, confirmation through volume analysis enhances its reliability. Traders should look for an increase in trading volume accompanying the bullish candlestick confirming the pattern. Elevated volume levels validate the bullish momentum and provide assurance to investors.
- Setting Entry and Exit Points: Establishing clear entry and exit points is crucial for managing risk and maximizing profits when trading based on the Morning Star pattern. Investors may consider entering long positions upon confirmation of the pattern with a bullish candlestick. Additionally, setting stop-loss orders below the low of the bullish candlestick can help mitigate potential losses in case of adverse price movements.
- Combining with Other Technical Indicators: While the Morning Star pattern can be a potent standalone signal, combining it with other technical indicators can enhance its effectiveness. Investors may integrate complementary indicators such as moving averages, relative strength index (RSI), or MACD (Moving Average Convergence Divergence) to validate signals and refine entry and exit points.
- Monitoring EBITDA Trends: In addition to technical analysis, fundamental factors such as a company’s financial performance can influence the efficacy of trading strategies based on the Morning Star pattern. Investors should monitor key financial metrics, including EBITDA (Earnings Before Interest, Taxes, Depreciation, and Amortization), to gauge the underlying strength of the securities they are trading.
- Practicing Patience and Discipline: Successful application of the Morning Star pattern requires patience and discipline. Traders should refrain from entering trades based solely on anticipation of the pattern and wait for clear confirmation signals. Additionally, adhering to risk management principles and avoiding emotional decision-making is paramount for long-term success.
FAQs
What is a Morning Star candlestick pattern?
The Morning Star is a bullish candlestick pattern that consists of three candles. It appears at the bottom of a downtrend and signals a potential reversal. The pattern starts with a long bearish candle, followed by a small-bodied candle (which can be bullish or bearish) that gaps below the previous candle, and concludes with a long bullish candle that closes above the midpoint of the first candle.
How is the Morning Star pattern identified?
- First Candle: A long bearish candlestick in a downtrend.
- Second Candle: A small candle that opens with a gap down from the previous close, indicating continued bearish sentiment but lesser momentum.
- Third Candle: A long bullish candle that opens with a gap up and closes at least halfway up the body of the first candle, suggesting a strong reversal.
What does the Morning Star pattern indicate?
The Morning Star pattern indicates that the bearish pressure is diminishing, and bulls are starting to take control. This change in momentum could signal the start of an upward trend.
How reliable is the Morning Star pattern?
Like all candlestick patterns, the Morning Star is more reliable when confirmed by other technical indicators like volume analysis, moving averages, or momentum oscillators. Higher trading volume on the third candle, for instance, can confirm the strength of the reversal.
What should traders consider before acting on a Morning Star pattern?
Traders should look for confirmation with other technical indicators and consider the overall market conditions. It’s also important to set appropriate stop-loss orders to manage risk in case the expected reversal fails to materialize.
Conclusion
The Morning Star candlestick pattern is a valuable tool for identifying potential trend reversals and capturing bullish opportunities in the Indian securities market. By understanding its characteristics, interpreting its signals, and applying it within a comprehensive trading strategy, investors can enhance their decision-making process and achieve greater success in the dynamic world of trading.