Managers often lose track of fast and slow movers in the warehouse, and that can lead to high holding costs and unhappy shoppers. Cost of goods sold divided by average inventory gives your inventory turnover ratio and shows how fast you sell stock.
In this post, we cover five key metrics like days on hand, stock-to-sales ratio, sell-through rate and backorder rate; we also show how to use inventory management software and supply chain management tools.
Read on.
Key Takeaways
- Inventory turnover ratio shows how fast you sell stock. You divide cost of goods sold by average inventory. A grocery store may hit 20 turns a year, while a computer shop sees about 6. High turnover cuts holding costs and frees cash flow.
- Days on Hand (DOH) tells you how many days you hold stock. You divide average inventory by cost of sales, then multiply by 365. With $50,000 in inventory and $365,000 in annual COGS, DOH equals 50 days. Low DOH lowers carrying costs.
- Sell-through rate measures units sold versus units received. You use (# units sold ÷ # units received) × 100. A high rate means fast sales and fewer slow movers.
- Stock-to-sales ratio compares inventory value to sales value. You divide inventory value by sales value. This ratio flags overstock or understock per dollar sold, helping you free cash flow.
- Backorder rate tracks delayed orders. You calculate (# delayed orders ÷ total orders) × 100. For example, 50 delays out of 500 orders yield a 10% backorder rate. A rate over 5% can hurt customer satisfaction.
Inventory Turnover Rate
Inventory turnover rate measures how many times you sell and replace stock in a year. You find it by dividing cost of goods sold by average inventory. If your shelves move like hotcakes, a grocery store might hit 20 turns a year.
Computer equipment shops often see about six, so gear sits a bit longer under the neon glow. High turnover feels like a fast relay race, and it shows smart inventory management and strong market demand.
You can use a simple inventory management program or a spreadsheet to watch this KPI. Linking point-of-sale data with an order management system delivers real time cost of goods sold updates.
You catch slow movers and dodge surplus stock. That slashes holding costs, frees cash flow, and lifts return on investment. Suppliers stay happy, customers find fresh picks, and your warehouse management system hums.
Days on Hand (DOH)

Days on Hand or DOH shows how many days a business holds stock before sale. It also reports the average days to sell inventory. You divide average inventory by cost of sales, then you multiply by 365.
This metric links to the inventory turnover ratio and the days sales of inventory (DSI) KPI. Low DOH can cut holding costs and improve cash flow. A high DOH can signal slow sales or excess stock.
Retailers often pair this with gross margin and fill rate to measure demand and customer satisfaction.
Managers can track DOH with an e-commerce order tracker or distribution center software. A retailer that holds $50,000 in average inventory and records $365,000 in annual cost of goods sold posts a DOH of 50 days.
Teams use this data to adjust reorder points and to avoid dead inventory. Tools like a forecasting engine and RFID scanners add precise signals on demand forecasting and market demand.
Automated racking in a smart warehouse can update average inventory stats in real time. Those signals boost operational efficiency, lower lost sales and heighten customer loyalty.
Sell-Through Rate
Following Days on Hand, managers shift focus to the sell-through rate. This rate measures how many units sell out of total received. They calculate it with (# Units Sold / # Units Received) × 100.
It acts as a key performance indicator for stock control and the comprehensive inventory management process. It ties directly to cost of goods sold and demand forecasting.
High sell-through rates show strong sales efficiency and quick inventory movement. Teams pull data from an order tracking tool and a storage management platform to chart trends. Simple BI software and forecasting models help spot weak spots fast.
Teams link sell-through data to supply chain dashboards for real-time alerts and tighter team collaboration.
Stock-to-Sales Ratio
Stock-to-sales ratio shows how much stock sits on shelves for every dollar sold. It divides inventory value by sales value. This metric fits right in your inventory management toolbox.
It acts as a key performance indicator. You see if you carry too much or too little. The simple math helps balance average inventory against actual demand.
Managers mix this ratio with cost of goods sold and holding costs data to spot slow items. A dashboard in an order management system can update it each day. Teams use it to trim dead stock, free up cash flow, and boost operational efficiency.
Business intelligence tools and warehouse management platforms bring these numbers to life. You gain a clear view of supply chain health, so you avoid lost sales and poor customer satisfaction.
Backorder Rate
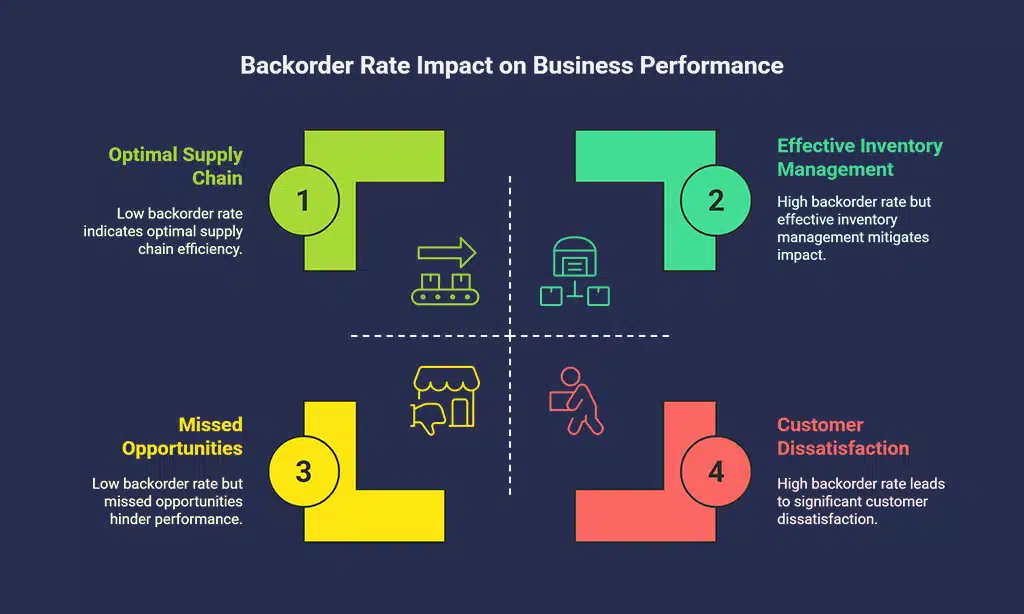
Backorder rate tracks delayed orders due to stock shortages. It uses a simple formula, (# Delayed Orders / Total # Orders) x 100. Managers plug in numbers in inventory management software.
A rate above 5% raises flags. For instance, 50 delayed orders out of 500 total orders yields a 10% rate. This key performance indicator fits right into inventory control dashboards.
It plays well with other KPIs like fill rate and lead time.
High backorder rates can hurt customer satisfaction fast. Customers expect fast delivery, like a smooth ride on a train. You know that sinking feeling when you wait days for a missing item.
Such delays can lead to lost sales or angry posts online. Teams use inventory control systems and predictive analytics to spot weak links. Staff tweak reorder points in material requirements planning.
They speed inventory replenishment and trim cost of goods sold. Lowering this rate frees up cash flow and boosts supply chain management.
How to Track and Analyze These Metrics
Use an inventory control system, a business dashboard, and IoT sensors to track turnover and sell-through, then fire up a demand forecast tool to map your data—keep reading!
Using inventory management software
Inventory management software logs key performance indicators instantly. It uses advanced analytics to improve operations and competitiveness. Systems show inventory turnover ratio and days on hand.
They also track sell-through rate in real time. A cloud ERP system helped 79 percent of finance teams cut month-end close times. Managers view dashboards, spot trends, lower holding costs, and boost cash flow.
Setting benchmarks for performance
With clear data from your inventory management software, you can set precise targets for performance. Grocery stores aim for 20 turns a year. Computer gear firms track six turns. Top firms nail a Cash-to-Cash Cycle under one month and boost cash flow.
Use the Perfect Order Index with four 99 percent steps to hit a 96 percent error-free rate. Set a goal for your inventory turnover ratio and sell-through rate as key performance indicators.
Lean managers watch holding costs and cost of goods sold to cut waste and lost sales. They track average inventory and lead time to lift customer satisfaction score.
Benefits of Monitoring Inventory Turnover Metrics
Use IoT sensors, a data analytics dashboard, and inventory management software to cut carrying costs, speed up cash flow, and delight customers—keep reading to find out more.
Improved operational efficiency
Managers track data with inventory management software and business intelligence. Real-time analytics tools spot slow sellers and keep average inventory in check. Using cost of goods sold data and the inventory turnover ratio, teams refine stock levels.
They track a Perfect Order Rate by multiplying on-time, complete, damage-free and accurate orders to target 100%.
Advanced analytics drive data-driven decisions that trim lead time and boost operational efficiency. Teams match stock to demand with key performance indicators, shifting flows faster.
That focus sheds light on reduced carrying costs.
Reduced carrying costs
Keeping fewer goods on hand cuts holding costs sharply. A simple formula shows the drop. Companies add support expenses, hazard expenses, funding charges, and shelf fees, then divide by total inventory value, times 100.
Grocer Pete’s Supercenter had a $1,000,000 average inventory and a 25 percent carrying cost. After raising inventory turnover from six to eight turns, the retailer slashed carrying expenses to 15 percent, saving $100,000 yearly.
IoT sensors and stock tracker applications keep inventory levels tight. Stock control platforms, order management systems, and demand forecasting tools work in sync with KPI dashboards to spot dead inventory and free up cash flow.
These savings frame the closing discussion.
Takeaway
Managers gain clear insight from metrics like stock flow ratio and days on hand. These measures cut carrying costs and boost cash flow. Smart tools, such as restock apps and chain coordination systems, pull real-time data.
Teams that watch sell-through pace, sales cost ratios and backorder counts adapt fast. This habit drives stronger customer satisfaction scores, smoother workflows and better profits.
FAQs on Inventory Turnover Metrics
1. What is inventory turnover rate?
Inventory turnover rate, or inventory turnover ratio, shows how often you sell and refill stock in a year. You divide cost of goods sold by average inventory. It helps spot dead inventory and frees cash for new stock.
2. How do you measure days sales of inventory?
Days sales of inventory tells you how long you keep stock before it sells. You use ending inventory, cost of goods sold, and a 365-day span. It helps with demand forecasting and avoids piling up slow items.
3. Why track sell-through rate?
Sell-through rate shows the share of items you sell from your shelf. You divide units sold by units you stocked. It links to your order management system and boosts sales forecasting.
4. What are holding costs and how do they affect cash flow?
Holding costs cover rent, insurance, and labor on stored stock. They eat into your cash flow like a slow leak. It’s like paying rent on an empty shelf, and it trims profits.
5. What is fill rate, and why does it matter for customer satisfaction score?
Fill rate is the percent of orders you ship in full and on time. It’s a key performance indicator in supply chain management and customer service. A strong fill rate helps lift your customer satisfaction score.
6. How do these metrics boost operational efficiency?
These key performance indicators, from inventory analysis to lead time, guide smarter choices. You refine inventory replenishment, tune warehouse management systems, and sharpen demand forecasting. The end result is lean stock, faster cash flow, and happy customers.