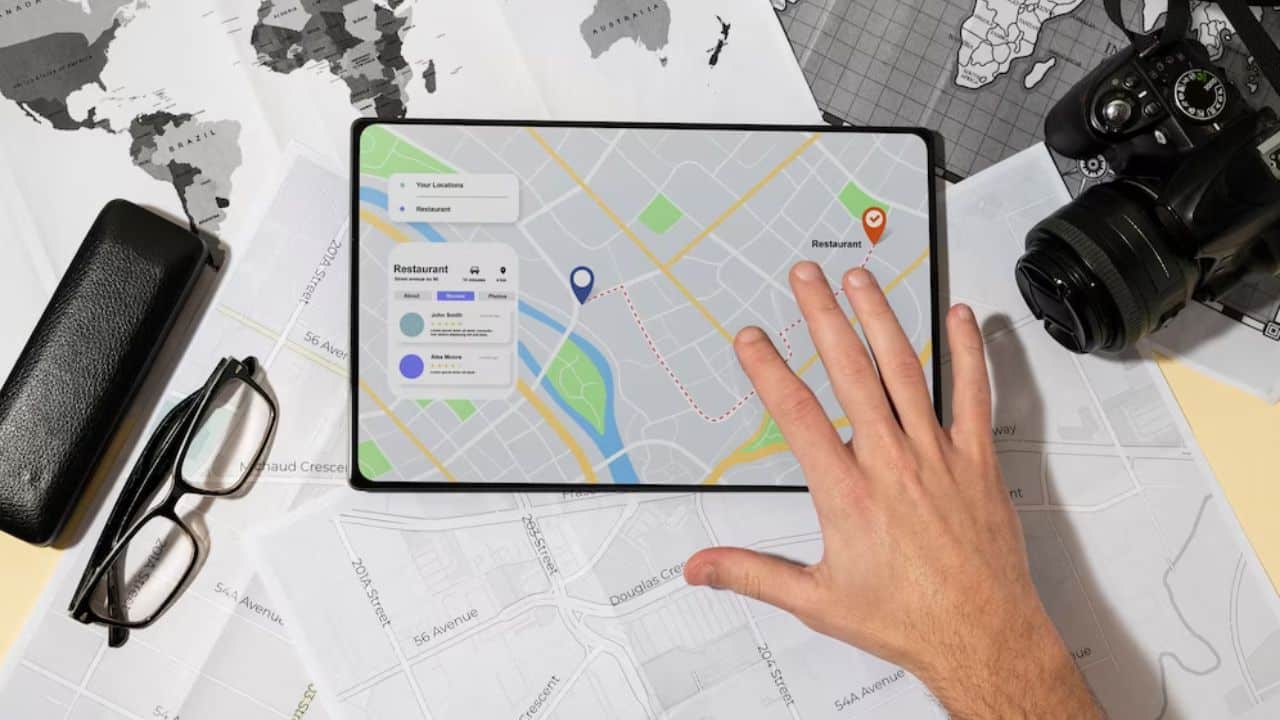
Google Maps is getting three new tools that will help you visualize rooftop solar potential, air quality, and pollen. To provide more information about the environment, the tools make use of Google’s artificial intelligence, machine learning, environmental data, and aerial images.
In 2015, the business launched Project Sunroof to assess solar potential. Google unveiled a new Solar API on August 28 that maps sites for precise data on rooftop solar potential. According to a corporate press release, the new tool will reveal the solar potential of over 320 million buildings in 40 nations.
Google’s Solar API was trained to extract data about roof shape, trees, and shade from aerial photos, as well as weather patterns and energy expenditures. The program displays consumers possible energy savings and is intended to make the process of installing solar panels faster and easier.
“The Solar API is a key input – it instantly gives us the data we need to analyze rooftops to determine how much sunlight they get in order to create customer proposals within the same workflow,” said Walid Halty, co-founder and CEO of Mona Lee Solar, a solar installation firm. “By doing this remotely and instantly, we save money and provide a better customer experience, allowing our company to grow quickly in this space.”
In addition to the Solar API, Google launched the Air Quality API, which offers customers with detailed air quality information. This project uses data from government monitoring stations, sensors, meteorological data, satellites, real-time traffic data, and other sources to generate location-specific and extremely comprehensive air quality information.
The application displays the air quality index (AQI), the main pollutant, the hourly history of air quality in an area, and even a breakdown of the principal pollutants. According to Google, this information can assist users in making health-related decisions, such as identifying when it is safe to spend time outside and arranging a trip route with the best air quality.
Read More: Top 10 Google Maps Features You Should Know
Pollen API, a third product released by the company, provides information on pollen count from top pollen sources. To determine pollen levels and dangers, it uses land cover, climatological data, yearly pollen production for different plants, and other data. According to the World Health Organization, this could benefit the 400 million individuals worldwide who suffer from allergic rhinitis, as well as the 67 million adults in the United States who suffer from seasonal allergies.
According to Google, these new tools can assist developers and businesses in developing sustainable solutions, as well as users in reducing their environmental effect.
“In the future, we hope to drive both short-term progress and long-term breakthroughs.” “No company, no matter how ambitious, can solve a problem as large as climate change on its own,” stated Saleem Van Groenou, product manager for Google Maps Platform. “Creating technology that enables us, our customers, and individuals all over the world to take meaningful action is one of the most powerful things we can do.” We’re excited about what the Solar API and our suite of Environment APIs can do.”


