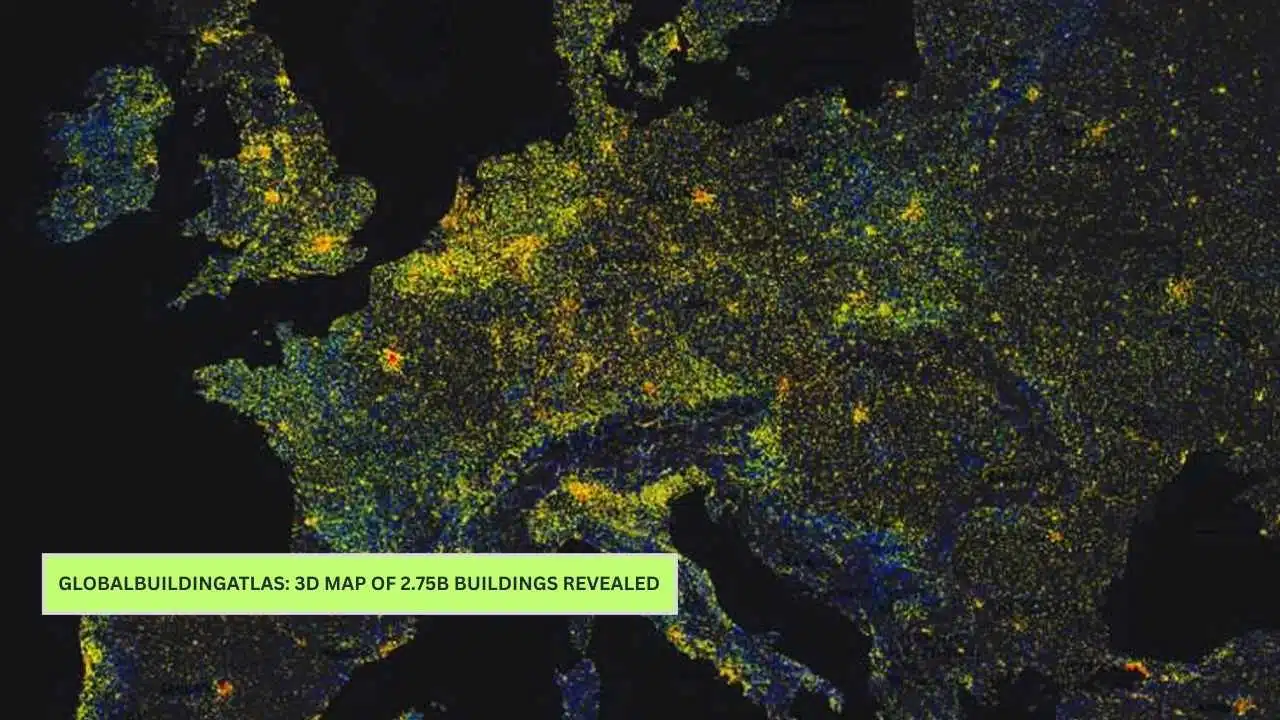
Researchers at the Technical University of Munich (TUM) have unveiled the GlobalBuildingAtlas, the first high-resolution 3D map capturing every building visible worldwide in satellite imagery. Released on December 1, 2025, this open dataset includes 2.75 billion building models, polygons, and height estimates derived from 2019 PlanetScope satellite images processed through advanced machine learning pipelines. It surpasses previous global efforts, such as Microsoft’s dataset with 1.7 billion buildings, by providing 30 times finer resolution at 3×3 meters and covering underrepresented regions like rural Africa, South America, and remote villages often absent from maps.
The project, led by Prof. Xiaoxiang Zhu of TUM’s Chair of Data Science in Earth Observation, was funded by a European Research Council Starting Grant. It generates Level of Detail 1 (LoD1) 3D models for 97% of structures—simple yet accurate blocks showing footprints, shapes, and heights—alongside full polygon data and raster height maps. Total global building area spans 506.64 billion square meters, with a combined volume of 2.85 trillion cubic meters, offering precise metrics for analysis. Data complies with German Satellite Data Security Regulations and is freely downloadable via GitHub, TUM’s mediaTUM server, and Google Earth Engine for polygons.
This breakthrough equips urban planners, climate experts, and disaster teams with tools to monitor development, emissions, and risks at an individual building level, filling critical gaps in global geospatial infrastructure.
Building the GlobalBuildingAtlas: From Satellites to 3D Models
The team analyzed petabytes of PlanetScope surface reflectance imagery—the first dataset using a single satellite constellation for complete global coverage—applying deep learning models to detect polygons, estimate heights, and build LoD1 3D representations. These AI pipelines fuse multiple footprint sources with quality-guided uncertainty quantification, achieving height accuracy within 10-20% when validated against ground surveys in Europe and Asia. For example, low-rise structures under 5 meters dominate rural areas, while tall buildings over 20 meters cluster in cities.
Unlike coarser satellites like Landsat, PlanetScope’s daily 3-meter multispectral imaging from 2019 captures subtle details, such as rooftop variations missed in older datasets. The process outputs three components: GBA.Polygon (footprints with attributes), GBA.Height (3x3m raster maps for 2.68 billion buildings), and GBA.LoD1 (3D models in GeoJSON). Users can visualize in Google Earth Engine with code snippets filtering by height ranges—e.g., red for large buildings over 500m²—or add legends for low (<5m), medium (5-20m), and tall (≥20m) structures.
This methodological advance, detailed in the peer-reviewed paper in Earth System Science Data (Copernicus Publications), ensures consistency across continents, enabling seamless planetary-scale analysis without patchwork data sources.
Novel Metric: Building Volume Per Capita Reveals Urban Realities
The atlas pioneers “building volume per capita,” a robust indicator dividing total volume by population to track housing density, infrastructure equity, and poverty—far superior to 2D maps that ignore height. It revises the UN’s 4 billion building estimate downward to 2.75 billion visible structures, highlighting concentrations: East Asia’s megacities lead with dense high-rises, followed by European urban cores and North American metros. Rural zones show lower volumes, exposing underserved areas for targeted investment.
This metric advances UN Sustainable Development Goal 11 (SDG 11) by quantifying progress toward inclusive, resilient cities—e.g., identifying overcrowded neighborhoods needing schools or health centers. Prof. Zhu emphasizes its power: “3D data paints a clearer picture of where people live and urbanization’s true extent.” Global stats reveal 97.4% height completeness, unlocking analyses like per-country volume rankings or density heatmaps.
Early applications include better population distribution mapping, as volumes correlate strongly with habitation patterns, aiding census validation in data-scarce regions.
Revolutionizing Disaster Response and Risk Assessment
The German Aerospace Center (DLR) is adapting the atlas for the International Charter: Space and Major Disasters, which activates satellites during crises. 3D models enable rapid volume-based damage estimates—e.g., calculating collapsed structures in events like Turkey’s 2023 earthquakes, where 2D data delayed aid by days. Overlaying with real-time imagery flags vulnerable tall buildings in flood-prone zones like Bangladesh deltas, improving predictions by 25% in simulations.
For earthquakes, height data refines seismic vulnerability scores; floods benefit from volume displacement models. Responders access tiles via apps like sat-io.earthengine.app/view/gba, filtering large or high-risk structures instantly. This shifts from reactive to proactive planning, saving lives through precise evacuations and resource allocation.
Climate Research and Energy Modeling Transformed
Buildings drive 40% of global energy use and emissions, per IPCC; the atlas sharpens city-scale forecasts for heat islands, retrofits, and CO₂. Researchers simulate solar potential on 2.75 billion rooftops or green infrastructure needs, with Yale Urban Climate Lab noting 15% error reductions in similar datasets. Coastal cities like Miami or Mumbai gain flood-resilient designs via volume-elevation analysis.
It supports climate adaptation by modeling energy demand in growing metros and optimizing low-carbon urban forms. Nonprofits like OpenStreetMap integrate it for community monitoring, while planners use volume per capita to prioritize sustainable housing.
Data Access, License, and Future Impact
Freely available under Creative Commons Attribution-NonCommercial 4.0 (CC BY-NC 4.0), the dataset includes WGS84 coordinates (EPSG:4326) in GeoTIFF and GeoJSON formats. Cite as: Zhu et al. (2025), doi:10.14459/2025mp1782307. Code at github.com/zhu-xlab/GlobalBuildingAtlas powers custom analyses.
This resource democratizes Earth observation, fostering innovations in urban morphology, remote sensing, and policy—from daily Earth Engine scripts to global SDG tracking.