Have you ever tapped a “Buy Now” button on your phone and just stared at a frozen screen? It is a super frustrating experience. Slow websites make people leave in a heartbeat. You want your page to feel instantly responsive when visitors click, tap, or type. Google actually has a specific name for this delay. It is called Interaction to Next Paint. This metric measures exactly how long it takes for your site to visually update after someone interacts with it.
In this Core Web Vitals: Interaction To Next Paint (INP) Guide, I am going to walk you through exactly why this matters. Grab your favorite drink. We will look at some incredibly simple steps to speed up your site and keep your visitors happy!
Core Web Vitals: Interaction To Next Paint (INP) Explained
Interaction to Next Paint (INP) tracks the exact time it takes for a webpage to respond after you click a link, tap a screen, or press a key on your keyboard. It measures the total delay from your physical action until your browser shows a visible change.

Google officially rolled out INP as a primary Core Web Vitals metric on March 12, 2024. Sites with fast scores feel incredibly snappy, while slow sites just cause confusion.
A 2025 report from web performance analysts at Pingdom found that 53% of mobile users in the US will abandon a site if a page takes more than three seconds to respond to their taps.
This core metric checks almost all page interactions, rather than just looking at your very first click. If you are shopping online and tap “Add to Cart,” INP logs that specific delay right up until a confirmation message pops up.
A great score means less waiting. It guarantees smooth browsing for every single user on both mobile phones and desktop computers.
Why Is INP Important for Web Performance?
Fast page response times make users incredibly happy. INP measures how quickly your site reacts to those critical clicks and key presses.
Since Google made it a ranking factor, a slow website means people might bounce before ever reading your content. Sluggish interactions directly hurt your page experience and ruin user satisfaction. A low INP score proves that your site respects a visitor’s time, whereas a high score means every click feels like walking through deep mud.
To put numbers to it, a recent 2024 study by Google on US retail sites showed that improving load speeds by just 100 milliseconds can increase conversion rates by up to 8%. Sites with better responsiveness keep users around longer. Quick, visual feedback after every single action builds instant trust.
How INP Works
INP checks exactly how fast your site responds after someone interacts with it. Are you curious about what happens behind the scenes? Let us find out.
Measuring user interactions
Tracking how fast a site responds helps you boost your overall web performance. User interactions are the actual heartbeat of your page experience.
- Track common browser events like “pointerdown” or “click” to see exactly when an action starts.
- Capture the exact moment the “next paint” happens, which shows when the site visibly changes.
- Measure the total delay between the input and the visual update to spot usability roadblocks.
- Use real-user monitoring tools to gather data from live US traffic, rather than relying strictly on lab simulations.
- Focus heavily on the longest delays, as one terrible interaction can ruin an entire visit.
Key components of INP: Input Delay, Processing Time, and Presentation Delay
Websites must respond to clicks and taps in a fraction of a second. These instant reactions rely on three distinct phases.
- Input Delay: This is the waiting period between a user’s tap and when the browser actually starts processing the request. Background tasks running from third-party US ad networks often cause this delay.
- Processing Time: This measures how long your browser spends running the specific code triggered by a click. If you notice a massive lag after opening a mobile menu, heavy JavaScript is usually the culprit.
- Presentation Delay: This tracks the time from when the code finishes running until the screen actually updates. Complex CSS animations or rendering huge page layouts will easily spike this number.
Each part plays a massive role in making digital interactions feel smooth. Lowering the time spent in these three stages improves the user experience for everyone.
Difference Between INP and First Input Delay (FID)
INP measures the entire journey from a user’s click until the page shows a visible change. First Input Delay (FID), the older metric it replaced, only tracked the delay between the very first input and when the browser started processing it.
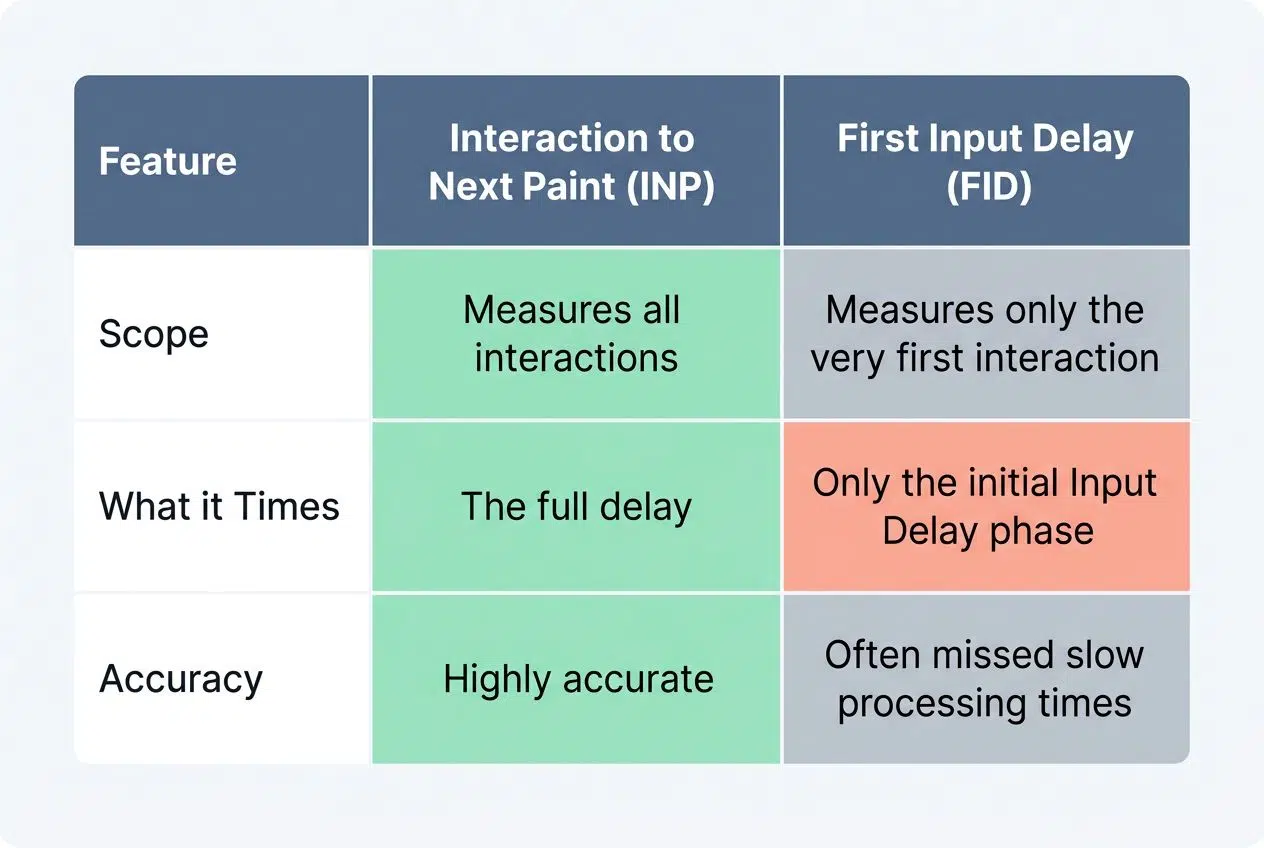
INP captures a much wider picture. It tracks every interaction on the page, not just the opening move.
| Feature | Interaction to Next Paint (INP) | First Input Delay (FID) |
|---|---|---|
| Scope | Measures all interactions throughout the lifespan of the page visit. | Measures only the very first interaction a user makes. |
| What it Times | The full delay (Input + Processing + Presentation). | Only the initial Input Delay phase. |
| Accuracy | Highly accurate representation of real-world user frustration. | Often, slow processing times are missed that happened after the start. |
If you tap a button, FID might clock a tiny 20-millisecond delay. However, INP waits for the full visual reaction. It might log 120 milliseconds before anything actually changes on the screen. Both are considered core metrics, but INP tells the honest truth about your actual page experience.
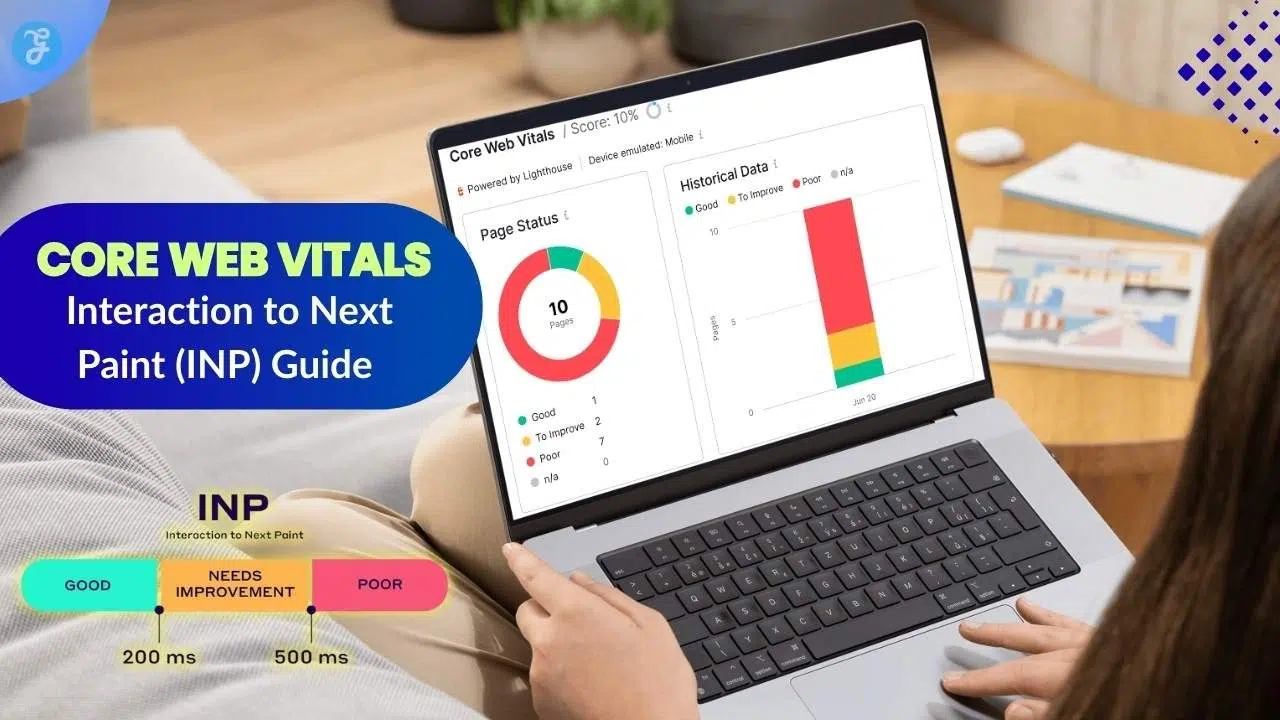
What Is a Good INP Score?
Both INP and the older FID metric measure how fast your website reacts. However, INP covers the entire lifespan of a user’s visit. To pass Google’s tests and provide a great experience, you need to hit very specific targets.
A good INP score is strictly 200 milliseconds or less. This ensures your page feels instantly responsive to every visitor.
If your score sits between 200 milliseconds and 500 milliseconds, your site needs improvement. Anything clocking in over 500 milliseconds is considered poor and will frustrate your users.
Search engines started enforcing these strict thresholds for their Core Web Vitals assessments back in early 2024. Keeping your response times firmly under that 200-millisecond mark will boost your SEO and keep your audience engaged.
How to Measure INP
You can easily track your responsiveness with a few handy developer tools. Each method gives you a slightly different piece of the puzzle.
Using Google PageSpeed Insights
Google PageSpeed Insights offers a fast, free way to check your scores. Just paste your website URL into the search bar, and the tool simulates both mobile and desktop environments.
The top section of the report lists your real-world Core Web Vitals results. This includes Interaction to Next Paint (INP), Largest Contentful Paint (LCP), and Cumulative Layout Shift (CLS). The results pull 28 days of historical data from actual Chrome users.
Green text means your site is fast, while red flags highlight a terrible delay. Scroll down to the diagnostics section to see exactly which scripts are causing your buttons to freeze.
Leveraging Google Search Console Core Web Vitals Report
Open your Google Search Console dashboard and click on the Core Web Vitals tab. Here, every URL on your site gets grouped by its performance status.
This tool is incredibly helpful because it groups similar pages together. If your product category pages all share a slow INP score, they will be bundled under a single warning. This real user data comes directly from the Chrome UX Report.
It is the easiest way to spot widespread performance issues across a massive US e-commerce site. You can easily see if a specific mobile menu or pop-up is causing trouble site-wide.
Measuring INP with Chrome DevTools
You can use Chrome DevTools to run live tests on your own computer. Simply press F12 on your keyboard, navigate to the “Performance” tab, and hit the record icon.
Start clicking buttons, opening menus, and typing in search bars to simulate a normal user experience. Stop the recording, and look closely at the “Interactions” track in the summary timeline.
A helpful pro-tip from the web development community on Reddit is to enable “CPU Throttling” during this test. Setting it to a 4x slowdown mimics how your site performs on an average smartphone. You will see clearly separated blocks for input delay, processing time, and presentation delay.
Using the web-vitals JavaScript Library
The web-vitals JavaScript library lets you track these core metrics directly within your own application code. You just add a tiny script to your site, and it begins logging real user data instantly.
Most developers configure this library to send the interaction data straight into Google Analytics 4 (GA4) or a specialized dashboard like Datadog. This gives your engineering team a live feed of your loading speed and latency.
You can easily catch a sluggish button before a major product launch ruins the user experience. You do not need expensive software to get started, as the code is completely free and available on GitHub.
Common Factors That Impact INP
Hidden technical problems can easily cause your website to freeze when a user clicks a button. These issues sneak up on growing sites.

Long tasks on the main thread
The main thread is the single pathway your browser uses to do almost everything, from drawing text to running complex code. If a JavaScript file takes over 50 milliseconds to run, it creates a long task.
While that long task is running, the browser cannot respond to anything else. If a user taps a link during this busy period, the page simply freezes. Scrolling becomes incredibly choppy, and dropdown menus fail to open.
To fix this, you must break massive blocks of JavaScript into smaller pieces so the browser can take a breath and answer user clicks.
Heavy DOM structures
A heavy DOM structure basically means your web page has too many invisible HTML boxes nested inside each other. Every single element on your page requires computing power to manage.
When a user clicks a button, the browser has to recalculate the position of all these elements. Google explicitly warns that pages with more than 1,500 total DOM nodes will suffer from severe input latency.
A common mistake on US news sites is hiding hundreds of old comments in the HTML rather than loading them only when requested. Keeping your page layout simple ensures immediate visual feedback.
Inefficient JavaScript execution
Slow, poorly optimized JavaScript will completely lock up your page. When users click a frozen button, they usually get frustrated and tap it five more times.
A very common culprit in 2026 is inefficient “hydration” in modern frameworks like React. The page looks ready to use, but the background code is still booting up and blocking user inputs.
Processing too many third-party tracking scripts at the same time will also cause massive delays. If your custom functions take longer than 50 milliseconds to execute, your Interaction to Next Paint scores will plummet.
How to Optimize INP
Speeding up your website is all about working smarter, not harder. Let us review some highly effective strategies to keep your site snappy.
Provide immediate user feedback
You must show users a clear visual signal, the absolute millisecond they interact with an element. If a heavy database search is going to take a moment, you cannot just leave the screen blank.
A pro-tip for web designers is to aggressively use CSS “: active” states. This instantly changes the color of a button the moment it is pressed, bypassing JavaScript entirely.
If the actual result takes more than 100 milliseconds to load, you should immediately display a skeleton loader or a spinning icon. These tiny visual cues drastically reduce user frustration and make the wait feel significantly shorter.
Break up long tasks into smaller chunks
Huge JavaScript jobs will completely block your main thread. If your site needs to sort a massive list of products, running it all at once will freeze the page.
Our Core Web Vitals: Interaction To Next Paint (INP) Guide highly recommends splitting these heavy jobs into smaller steps. Many modern developers are using the new “scheduler.yield()” API in 2026.
This brilliant command tells the browser to pause a heavy task, check if a user just clicked something, and then resume the work. If you are supporting older browsers, a simple “setTimeout” function achieves a very similar result.
Reduce input delay with optimized interaction handlers
Fast interaction handlers ensure that clicks and keyboard taps register instantly. You should never put heavy calculations directly inside a click event.
A massive mistake developers make is running a complex search filter the exact millisecond a user types a single letter. Instead, you should use a coding technique called “debouncing.”
This forces the browser to wait a few milliseconds after the user stops typing before it starts the heavy lifting. Moving this complex logic away from the direct input keeps your latency practically non-existent.
Use Web Workers to offload main-thread work
If breaking up tasks is not enough, you need to bring in Web Workers. These act like a completely separate, invisible browser tab that runs complex math in the background.
Because they run on a totally different thread, they cannot block your users from clicking links or scrolling. A brilliant tool gaining popularity in 2025 and 2026 is Partytown.
This library automatically moves heavy third-party marketing scripts and analytics into a Web Worker. By offloading this junk, your main thread stays entirely free to handle e-commerce menus and shopping carts instantly.
Minimize recurring timers and unnecessary scripts
Recurring background timers will quietly eat up all your computing power. Functions like “setInterval” that constantly poll for data can easily interrupt a user’s tap.
Many marketing teams leave old A/B testing scripts running on their site long after the experiment is over. These forgotten scripts evaluate the page constantly and create massive lag during user interactions.
You should routinely audit your Google Tag Manager account and strictly delete any tracking pixel or chat widget that your business no longer actively uses. Removing dead code is the fastest way to boost web performance.
Real-World Examples of Improving INP
You can see big wins by tweaking how fast menus and dialogs react to clicks or taps. Sometimes, the smallest fix brings a mountain of speed.

A massive US-based clothing retailer recently struggled with terrible menu responsiveness. Mobile shoppers were tapping the navigation icon and waiting nearly 600 milliseconds for the categories to drop down.
Their technical team audited the site and discovered that their heavy search autocomplete script was blocking the entire menu from rendering.
- They moved the search logic into a background Web Worker.
- They pre-rendered the basic HTML of the menu, so it existed before the click.
- They added instant CSS hover and active states for immediate visual feedback.
Following these simple changes, their menu response time dropped beautifully to just 120 milliseconds.
Case study: Optimizing consent dialog interactions
A major digital news publisher noticed a massive spike in their bounce rates. The primary culprit was an incredibly sluggish cookie consent banner.
When visitors tapped “Accept All,” the page visibly froze while the browser tried to load a dozen different advertising trackers simultaneously. The engineers immediately broke up the tracking initialization into smaller chunks.
They also added a lightning-fast loading spinner to the “Accept” button. Within just three weeks, their average INP score plummeted from a failing 450 milliseconds down to a passing 140 milliseconds.
Does INP Impact SEO?
Google officially uses Core Web Vitals to judge your overall page experience. Excellent web performance will directly lift your site in the search engine rankings.
In March 2024, Google fully retired First Input Delay (FID) and officially made INP a primary ranking signal for search results.
If your site suffers from poor click response times, you actively risk losing your top placement on Google. A slow website frustrates visitors, and Google’s algorithm easily notices when users quickly bounce back to the search results.
Fast websites naturally earn more traffic. Monitoring tools like the Search Console report are completely essential for protecting your hard-earned SEO rankings.
Best Tools to Monitor and Debug INP
These handy tools shine a light on your site’s responsiveness. They make it incredibly easy to see exactly what is slowing you down.
INP Debugger
The official Web Vitals Chrome Extension includes a brilliant real-time debugging feature. It acts like an X-ray machine for your website.
This tool displays a small overlay on your screen. It shows exactly how long your clicks, taps, and keyboard presses take to resolve in real-time. It clearly breaks down the math, showing you the exact milliseconds spent on input delay, processing, and rendering.
Frontend developers rely on this to spot exactly which JavaScript function is causing a specific lag. By seeing exactly where the delay happens, you save hours of frustrating guesswork.
Chrome UX Report (CrUX)
The Chrome UX Report, known as CrUX, offers the ultimate truth about your web performance. It is a massive, public database of real-world user experiences gathered straight from Google Chrome browsers.
You can easily connect this free dataset to a Google Looker Studio dashboard to create beautiful performance graphs. This data shows you exactly how real visitors in the US are experiencing your latency on 4G networks or older mobile devices.
Because Google updates this dataset every 28 days, it is the exact same data their search algorithm uses to rank your site.
Site Speed Chrome Extension
Many developers also use integrated tools right inside Google Chrome to check their speeds as they browse. You can run a Lighthouse performance audit directly from your browser’s inspect panel. It tracks essential metrics like Interaction to Next Paint (INP) while simulating a slower mobile connection.
It will instantly highlight your most sluggish scripts in bright red. By generating these instant reports, your team can easily spot bottlenecks without ever leaving the webpage.
Wrapping Up
Achieving strong scores is the best way to boost your page experience and keep your audience engaged. Fast, snappy buttons encourage visitors to browse longer and buy more. Our comprehensive Interaction To Next Paint (INP) Guide shows that great web performance is totally within your reach.
Modern developer tools make it incredibly easy to spot slowdowns before they frustrate your customers. Simple changes like splitting up your long tasks will make your pages feel faster than ever before.
Take a few minutes today to check your scores. Your visitors will definitely thank you for it!