The MACD, or Moving Average Convergence Divergence, is a highly effective tool for gauging market momentum that has found a broad user base among both experienced traders and those just starting. In this guide, we’ll provide an overview of the MACD and explain how traders can utilize it, as well as discuss some of its potential drawbacks. To know more about bitcoin trading you can visit Bitcoin Sprint
Understanding MACD
MACD is created to be an easy-to-use analysis procedure which calls for virtually no upkeep. It’s a method utilized in technical analysis (TA) to figure out momentum power and closely follow the price changes of an asset. This TA indicator is often called an oscillator, which displays the price moves between two Bands, similar to Bollinger or RSI bands. So traders can determine if a cryptocurrency such as Bitcoin is oversold and overbought, oscillators offer to buy as well as sell signals.
MACD is a famous trading application which was developed by Gerald Appel, a prominent trader within the markets. Being a financial consultant for more than fifty years, Appel created the MACD to look at new indicators. He stated he was merely looking for new methods to evaluate the marketplaces when asked about his creation.
How does MACD work?
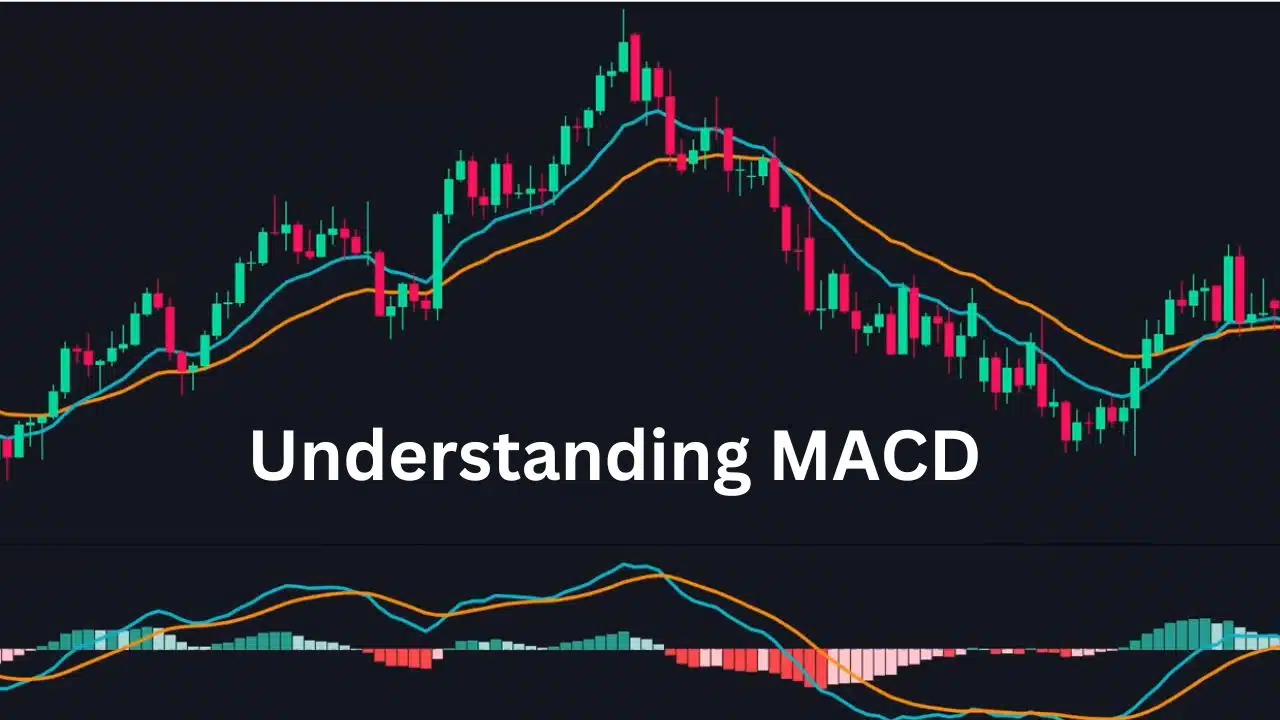
The MACD indicator includes two primary lines, which are essential to get a grasp of it. Let us take a look at the moving average (MA) initially. Moving averages are utilized to examine the price change of an asset during a specified period and show it on a chart as being a line. This lets traders see better the long-run patterns. The MACD utilizes an exponential moving average (EMA) that provides the latest cost information with much more significance when compared with older information.
- Signal Line: The signal line is used largely to anticipate a direction reverse in the marketplace whenever it’s examined together with the MACD line. The signal lines utilize an EMA indicating the motion of the MACD line in the prior nine days. This’s distinct from the MACD line, which represents the average price impact.
- MACD Histogram: The histogram brings together information from both signal lines as well as the MACD. It’s a graphic representation of just how close these two lines are. To streamline the graph, the MACD histograms are shown in bar charts.
- MACD Line: The MACD line is created primarily to keep up with the dynamism of the marketplace. It indicates the distance between two EMAs. These EMAs are derived from the selling price of an item. The MACD line features price information from the last twelve and 26 days in default. Based on those two averages, it can create a single line. With regards to precisely what the trader wishes, the timeframe could be changed.
What are the limitations of MACD?
The usage of the MACD program is mostly subjective. The trader’s analysis approach is going to figure out the possible disadvantages. The MACD price divergence method is often misleading in case it’s utilized alone, it could provide false signals. These signals sound much more like suggestions than rules. Any pattern reverses you may think about from a MACD chart have been followed up with more technical analysis.
In addition, information used for checking out crossovers will usually be behind genuine price action. It is an excellent method of reading through long-term trend lines, however, the indicators might come way too soon for day traders to make use of their research. Within an already trending sector, the MACD could be quite helpful. It may be an effective method of evaluating possible reversals as well as momentum strength. The MACD’s usefulness is, nevertheless, slightly reduced in a sideways-moving market.