You know that feeling when your customer acquisition costs keep climbing while your monthly recurring revenue barely budges? We’ve been there. The culprit is usually hiding in one deceptively simple number: SaaS LTV.
SaaS LTV, or Customer Lifetime Value, reveals exactly how much revenue a customer generates before they churn. This metric shapes every major decision, from how much you can afford to spend on ads to whether your business model actually works. The LTV to CAC ratio sits at the heart of this calculation. According to recent 2026 benchmarks, a healthy ratio now falls between 3:1 and 4:1, up from the traditional 3:1 standard.
Here’s what that means for your wallet. If you’re spending $300 to acquire a customer but they only generate $600 in lifetime revenue, you’re operating at a 2:1 ratio. That’s below the benchmark, and you’re likely burning cash faster than you’re building sustainable growth.
We’re going to walk through every method on how to calculate SaaS LTV, show you which tools make tracking effortless, and reveal the specific levers that boost your numbers. Small shifts in metrics like average revenue per account or churn rate compound into massive wins over time.
What is SaaS LTV?
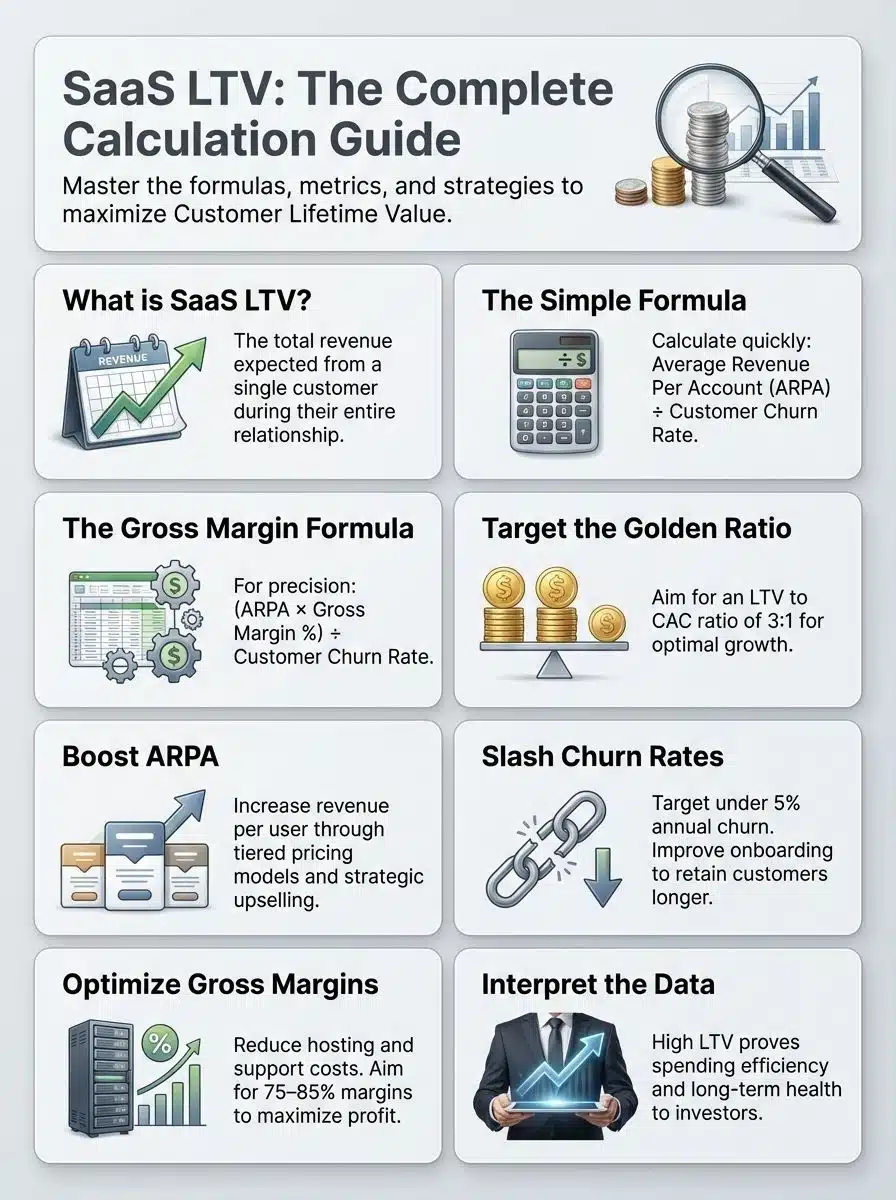
SaaS LTV measures the total revenue we expect to collect from a single customer throughout their entire relationship with our company. It’s the foundation of every Software as a Service business model because recurring revenue demands a long-term view.
Think of it this way. A customer pays you $50 per month and stays for 24 months. Their lifetime value is $1,200.
But here’s where it gets strategic. If your customer acquisition cost is $400, you need that person to stick around for at least eight months just to break even. LTV tells you if the math works before you scale your marketing spend.
The metric also reveals which customer segments drive the most profit. According to analytics from platforms like Baremetrics and ChartMogul, companies with higher LTV can invest more aggressively in retention programs and premium support, creating a flywheel effect. Your best customers fund the acquisition of more best customers.
Investors scrutinize LTV because it signals product-market fit and capital efficiency. A climbing LTV means customers find increasing value over time. A flat or declining LTV suggests churn issues or weak upsell strategies, both red flags for early-stage SaaS startups looking for funding.
How to Calculate SaaS LTV
We calculate customer lifetime value using clear formulas and real subscription data. The right approach depends on your business maturity and data availability. Understanding these methods helps us make smart decisions about customer acquisition budgets and retention investments.
Simple LTV Formula
The basic formula divides your Average Revenue Per Account (ARPA) by your customer churn rate. If ARPA is $100 and the churn rate is 5%, the math is straightforward: $100 divided by 0.05 equals $2,000.
This tells you each customer generates $2,000 in revenue before they cancel.
The beauty of this method is speed. You can calculate it in under a minute using data from any SaaS analytics platform like Mixpanel or Amplitude. It gives early-stage companies a fast baseline to compare against industry benchmarks.
The limitation? It assumes all customers behave the same way, which isn’t true once you have multiple pricing tiers or customer segments. That’s when you need cohort analysis or the gross margin formula for more precision.
Gross Margin LTV Formula
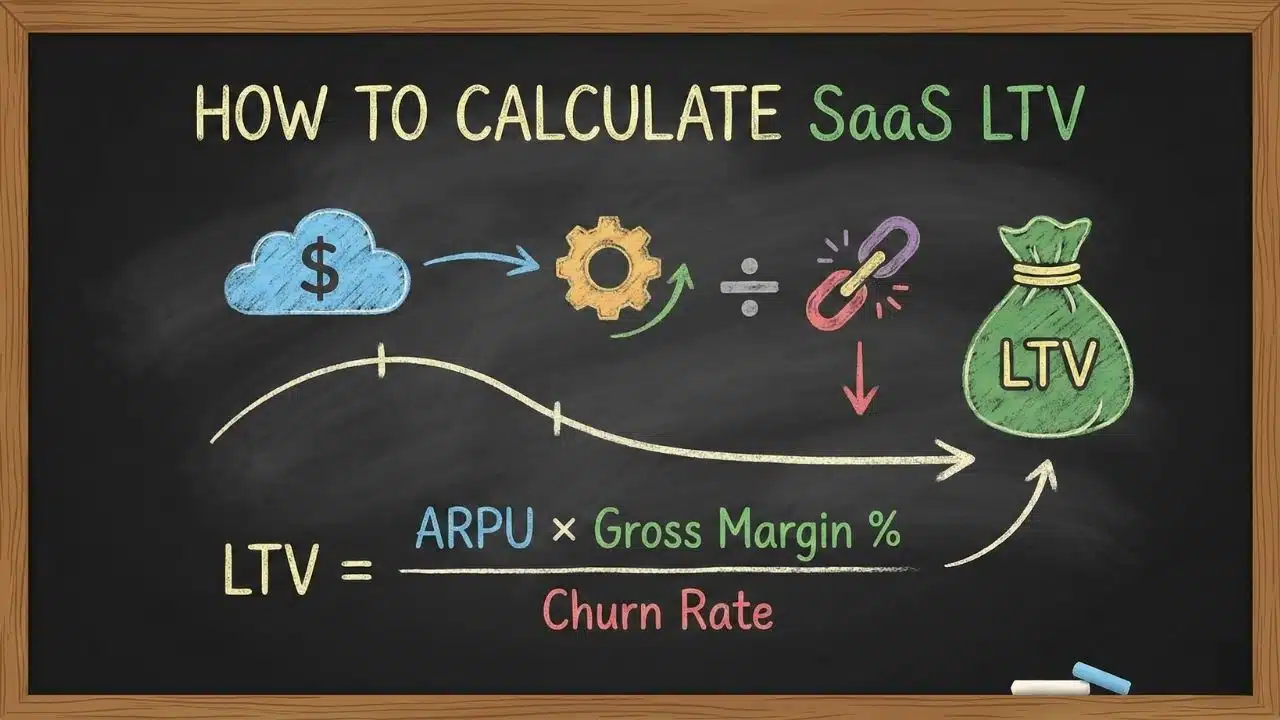
Gross margin LTV shows the actual profit a customer brings after we subtract the cost of delivering our service. The formula is (Average Revenue Per Account times Gross Margin) divided by Customer Churn Rate.
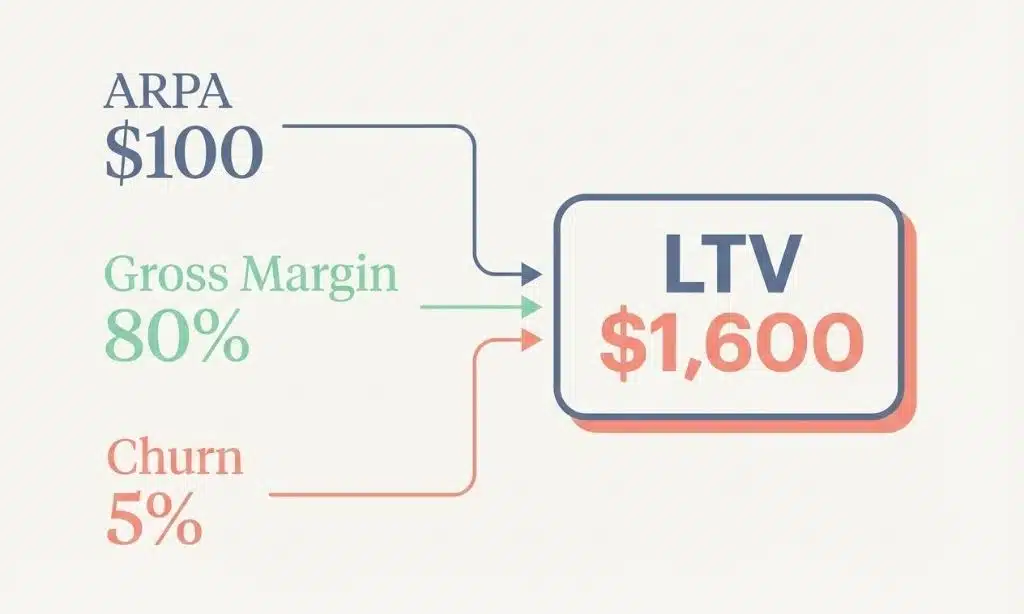
Here’s a real example. Your ARPA is $100, gross margin is 80% (which means you keep $80 after hosting and support costs), and churn rate is 5%. The calculation becomes ($100 times 0.80) divided by 0.05, which equals $1,600 per customer.
This number is more honest than simple LTV because it accounts for the real costs of cloud infrastructure, customer support salaries, and third-party API fees. According to 2026 data from Benchmarkit, SaaS companies should target gross margins of 75% or higher. Anything below 70% raises concerns from investors and financial advisors.
The margin multiple matters here. If your ARR is $2.5 million from 10,000 customers, your ARPA is $250. At 80% gross margin, you keep $200 per user. With a 5% churn rate, your retention rate is 95%, giving you a margin multiple of about 6.3. That means each customer generates roughly $1,260 in gross profit over their lifetime.
These specific numbers guide customer acquisition strategies and help us set realistic targets for improving LTV across different cohorts.
Key Metrics for SaaS LTV Calculation
Three core data points determine how much value each customer brings. Each one directly impacts the lifetime value calculation and reveals where to focus improvement efforts.
Average Revenue Per Account (ARPA)
ARPA measures how much revenue we generate each month from a single customer account. We calculate it by dividing monthly recurring revenue by the total number of accounts.
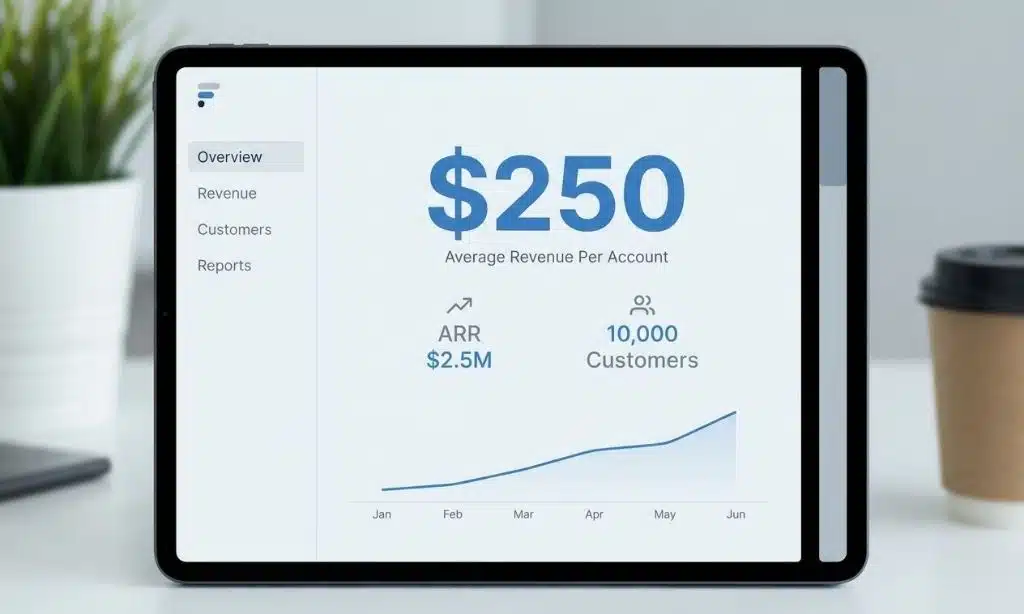
Here’s the math in action. If your annual recurring revenue is $2.5 million and you serve 10,000 customers, your ARPA sits at $250.
A higher ARPA creates more room in your unit economics. You can afford higher customer acquisition costs and invest more in premium features. Companies using tools like ChartMogul track ARPA by customer segment because enterprise accounts often generate 10 times more revenue than SMB customers.
The fastest ways to boost ARPA include tiered pricing models, usage-based billing, and strategic upsells. Automated billing platforms reveal which add-ons convert best and which customer cohorts show the highest spending potential, helping you optimize pricing without guesswork.
Customer Churn Rate
Churn rate measures the percentage of customers who cancel in a given period. The formula is simple: Customers Lost divided by Customers at Start, multiplied by 100%.
If you start the month with 100 users and lose 5, your churn is 5%. This means your retention rate is 95%, and the typical customer stays for about 20 months.
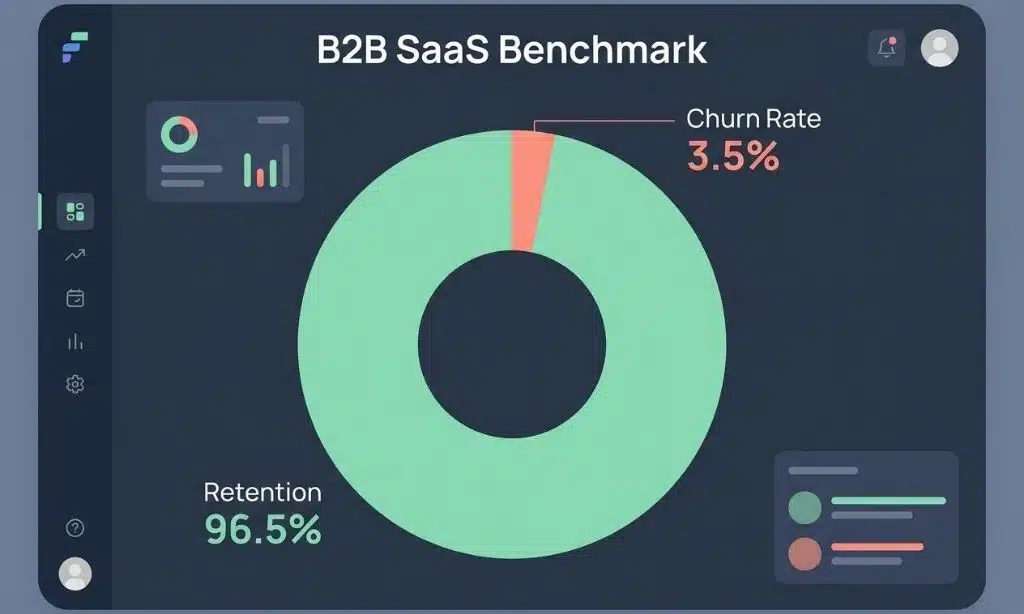
According to 2025 data from Recurly, the median churn rate for B2B SaaS companies is 3.5%, split between voluntary churn at 2.6% and involuntary churn at 0.8%. Companies serving enterprises often achieve monthly churn below 1%, translating to annual churn around 11% due to compounding.
High churn kills LTV fast. A 10% monthly churn rate means you lose roughly 72% of customers annually, which is unsustainable. Tools like Baremetrics and Amplitude help us identify which customer segments churn fastest, so we can deploy targeted retention programs before it’s too late.
Gross Margin Percentage
Gross margin reveals how much profit we keep from each dollar after paying for the costs to deliver our SaaS product. The formula is: (Revenue minus Cost of Goods Sold) divided by Revenue.
If your ARPA is $250 and your gross margin is 80%, you keep $200 as gross contribution per customer. That $200 is what you have available to cover sales, marketing, and overhead expenses.
A strong gross margin gives you flexibility. You can invest more in growth initiatives, weather downturns, and command higher valuations. According to G-Squared Partners’ 2026 analysis, SaaS companies should aim for at least 75% gross margin on software subscriptions. AI-native competitors often operate at lower margins due to compute costs, making this benchmark even more critical for traditional SaaS businesses.
Improving this metric directly lifts your LTV across all customer segments. Every percentage point increase means more cash to reinvest in features, support, or expansion revenue strategies.
How to Interpret SaaS LTV
LTV shows the total value a customer delivers, but the real insight comes from comparing it to what you spend to acquire them.
The LTV to CAC ratio is your north star metric. It tells you if your business model generates profit or burns cash. A 3:1 ratio means every dollar spent on customer acquisition returns three dollars in gross profit, which investors consider the minimum for sustainable growth.
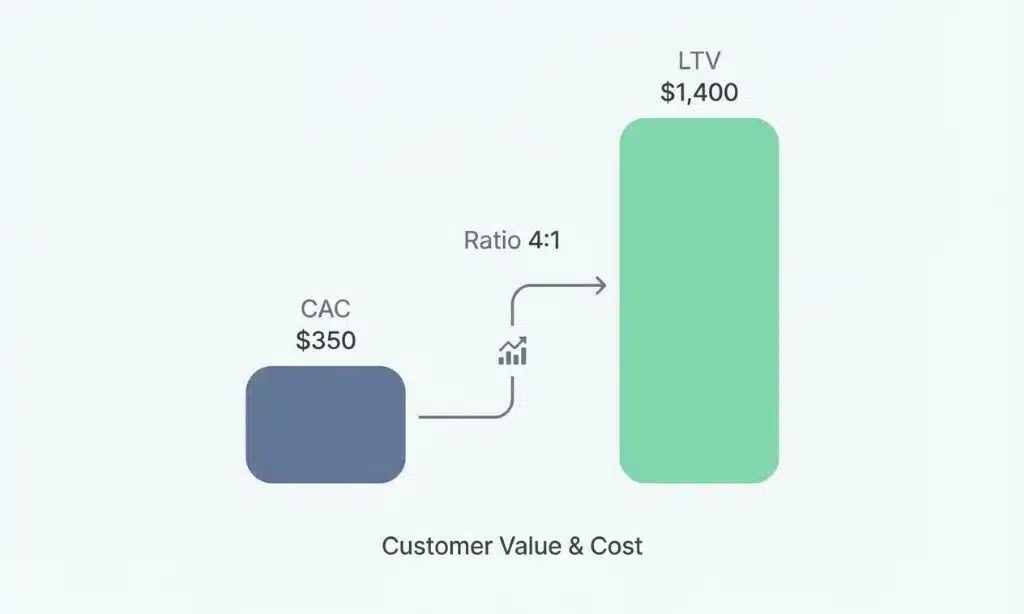
According to 2026 benchmarks from industry analysts, the standard has shifted upward. Many SaaS companies now target 4:1 as capital becomes more expensive and investors demand greater efficiency. This means if your CAC is $350, you need an LTV of at least $1,400 to meet the new baseline.
Here’s what different ratios signal. Below 1:1 is a crisis; you lose money on every customer. A ratio between 1:1 and 3:1 suggests problems with retention, pricing, or acquisition efficiency. Above 5:1 indicates you’re underinvesting in growth and leaving market share on the table.
Low ratios often point to weak product-market fit, high churn, or inefficient sales processes. Companies like Etsy and many B2B SaaS startups track these numbers monthly before making major investments or considering M&A opportunities. If your ratio drops suddenly, it’s a warning sign to investigate churn patterns or recalculate your gross margin assumptions.
How to Improve SaaS LTV
Three strategic levers lift lifetime value. Each one compounds over time and requires different tactics to execute well.
Increase ARPA
Raising average revenue per account boosts LTV immediately because each customer generates more revenue at the same churn rate.
Tiered pricing is the fastest path here. Offer a basic plan, a professional plan with more features, and an enterprise plan with premium support. This structure lets you capture budget-conscious customers while monetizing power users who need advanced capabilities.
Usage-based pricing models also work well. Companies using Stripe Billing or Chargebee can automatically charge customers based on consumption metrics like API calls, storage, or active users. This aligns pricing with value delivered and often increases ARPA as customers grow.
Strategic upselling matters too. Platforms like Pendo and Userpilot identify which features correlate with higher retention, then trigger in-app prompts when users hit certain milestones. For example, if customers who export reports more than 10 times per month rarely churn, you can create a premium reporting tier and offer upgrades at that trigger point.
Testing is critical. A/B test pricing changes on small segments before rolling out company-wide. Even a 10% price increase on your professional tier can lift overall ARPA by 5% to 7% if executed with clear value messaging and grandfathering for existing customers.
Reduce Churn Rate
Keeping customers longer has an outsized impact on LTV. A drop from 5% to 3% monthly churn increases the average customer lifetime from 20 months to 33 months, a 65% improvement.
Smooth onboarding prevents early exits. According to research from Reforge, companies that improve first-week retention see those gains cascade through the entire customer lifecycle. Tools like Appcues and Chameleon help you build interactive product tours that guide new users to their first “aha moment” within the first session.
Segmentation reveals which accounts are at risk. Analytics platforms like Amplitude and Mixpanel let you build cohorts based on usage patterns. If users who don’t log in within seven days have a 40% churn rate, you can trigger email sequences or customer success outreach before they ghost.
Customer success programs work. Assigning dedicated success managers to high-value accounts builds relationships and catches problems early. Even automated check-ins using tools like Intercom or Zendesk reduce churn by making customers feel supported.
If annual churn climbs above 5% for enterprise SaaS, something fundamental is broken. Review your product roadmap, talk to churned customers, and fix the core issue before scaling acquisition.
Optimize Gross Margin
Every dollar saved on delivery costs flows straight to your bottom line and lifts gross margin LTV.
Cloud infrastructure optimization is low-hanging fruit. Many SaaS companies overspend on AWS, Google Cloud, or Azure by 20% to 40% because they don’t right-size instances or use reserved capacity. Tools like CloudZero help you track costs by customer, feature, or team, revealing exactly where to cut without impacting performance.
Automate customer support where possible. Self-service knowledge bases and AI chatbots handle common questions, reducing the support team headcount needed per thousand customers. Companies like Notion and Slack built extensive documentation and community forums that deflect 60% to 70% of support tickets.
Review your COGS definition quarterly. Make sure you’re correctly categorizing costs as either delivery costs (which impact gross margin) or operating expenses (which don’t). Misclassifying sales commissions or R&D salaries as COGS artificially deflates your margin and makes unit economics look worse than they are.
Most SaaS companies target a 75% to 85% gross margin. If you’re below 70%, audit your cost structure immediately. The gap between a 70% margin and an 80% margin is the difference between $600 and $800 in gross profit per $1,000 of revenue, a massive impact on LTV and valuation multiples.
Final Words
We’ve covered how to calculate and improve SaaS LTV using proven formulas and current benchmarks. Understanding your customer lifetime value helps you spot healthy unit economics, set smart acquisition budgets, and build a profitable business that scales.
The key metrics, ARPA, churn rate, and gross margin, work together to determine your LTV. Tools like Baremetrics, ChartMogul, and Amplitude make tracking these numbers straightforward and reveal exactly where to focus improvement efforts.
Applying these methods works for any SaaS business that wants to maximize return on every customer acquisition dollar. Better LTV drives stronger growth, attracts investors, and creates sustainable results over time. Focus on the data with discipline, and you’ll build a company where each customer brings real value that compounds month after month.